Download
1 / 30
340 likes | 384 Views
Location Planning and Analysis. Learning Objectives. List some of the main reasons organizations need to make location decisions. Explain why location decisions are important. Discuss the options that are available for location decisions.

E N D
Learning Objectives • List some of the main reasons organizations need to make location decisions. • Explain why location decisions are important. • Discuss the options that are available for location decisions. • Describe some of the major factors that affect location decisions. • Outline the decision process for making these kinds of decisions. • Use the techniques presented to solve typical problems.
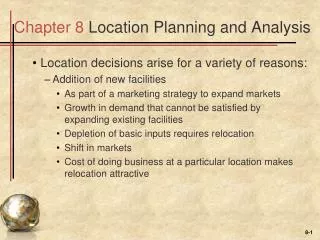
Needs for Location Decisions • Marketing Strategy • Cost of Doing Business • Growth • Depletion of Resources
Nature of Location Decisions • Strategic Importance of location decisions • Long term commitment/costs • Impact on investments, revenues, and operations • Supply chains • Objectives of location decisions • Profit potential • No single location may be better than others • Identify several locations from which to choose • Location Options • Expand existing facilities • Add new facilities • Move
Making Location Decisions • Decide on the criteria • Identify the important factors • Develop location alternatives • Evaluate the alternatives • Identify general region • Identify a small number of community alternatives • Identify site alternatives • Evaluate and make selection
Regional Factors • Location of raw materials • Location of markets • Labor factors • Climate and taxes
Community Considerations • Quality of life • Services • Attitudes • Taxes • Environmental regulations • Utilities • Developer support
Site Related Factors • Land • Transportation • Environmental • Legal
Multiple Plant Strategies • Product plant strategy • Market area plant strategy • Process plant strategy
Service and Retail Locations • Manufacturers – cost focused • Service and retail – revenue focused • Traffic volume and convenience most important • Demographics • Age • Income • Education • Location, location, location • Good transportation • Customer safety
Trends in Locations • Foreign producers locating in Developed countries. • “Made in USA” • Currency fluctuations • Just-in-time manufacturing techniques • Microfactories • Information Technology
Globalization • Facilitating Factors • Trade agreements • Technology • Benefits • Markets • Cost savings • Legal and regulatory • Financial
Globalization • Disadvantages • Transportation costs • Security • Unskilled labor • Import restrictions • Criticisms • Risks • Political • Terrorism • Legal • Cultural
Evaluating Locations • Cost-Profit-Volume Analysis • Determine fixed and variable costs • Plot total costs • Determine lowest total costs
Location Cost-Volume Analysis • Assumptions • Fixed costs are constant • Variable costs are linear • Output can be closely estimated • Only one product involved
Example 1: Cost-Volume Analysis Fixed and variable costs for four potential locations
Example 1: Solution $(000) 800 700 600 500 400 300 200 100 0 D B C A A Superior C Superior B Superior 0 2 4 6 8 10 12 14 16 Annual Output (000)
Evaluating Locations • Transportation Model • Decision based on movement costs of raw materials or finished goods • Factor Rating • Decision based on quantitative and qualitative inputs • Center of Gravity Method • Decision based on minimum distribution costs
Factor-Rating Example Critical Scores Success (out of 100) Weighted Scores Factor Weight France Denmark France Denmark Labor availability and attitude.25 70 60 (.25)(70) = 17.5 (.25)(60) = 15.0 People-tocar ratio .05 50 60 (.05)(50) = 2.5 (.05)(60) = 3.0 Per capitaincome .10 85 80 (.10)(85) = 8.5 (.10)(80) = 8.0 Tax structure .39 75 70 (.39)(75) = 29.3 (.39)(70) = 27.3 Educationand health .21 60 70 (.21)(60) = 12.6 (.21)(70) = 14.7 Totals 1.00 70.4 68.0
Center-of-Gravity Method ∑dixQi ∑Qi i x - coordinate = i ∑diyQi ∑Qi i y - coordinate = i where dix = x-coordinate of location i diy = y-coordinate of location i Qi = Quantity of goods moved to or from location i
Center-of-Gravity Method North-South New York (130, 130) 120 – 90 – 60 – 30 – – Chicago (30, 120) Pittsburgh (90, 110) Atlanta (60, 40) | | | | | | 30 60 90 120 150 East-West Arbitrary origin
Center-of-Gravity Method Number of Containers Store Location Shipped per Month Chicago (30, 120) 2,000 Pittsburgh (90, 110) 1,000 New York (130, 130) 1,000 Atlanta (60, 40) 2,000 (30)(2000) + (90)(1000) + (130)(1000) + (60)(2000) 2000 + 1000 + 1000 + 2000 x-coordinate = = 66.7 (120)(2000) + (110)(1000) + (130)(1000) + (40)(2000) 2000 + 1000 + 1000 + 2000 y-coordinate = = 93.3
Center-of-Gravity Method North-South New York (130, 130) 120 – 90 – 60 – 30 – – Chicago (30, 120) Pittsburgh (90, 110) + Center of gravity (66.7, 93.3) Atlanta (60, 40) | | | | | | 30 60 90 120 150 East-West Arbitrary origin
Requirements for Transportation Model • List of origins and each one’s capacity • List of destinations and each one’s demand • Unit cost of shipping
Transportation Model Assumptions • Items to be shipped are homogeneous • Shipping cost per unit is the same • Only one route between origin and destination
The Transportation Problem D (demand) S (supply) S (supply) D (demand) D (demand) S (supply) D (demand)
A Transportation Table Warehouse A B C D Factory 7 4 7 1 Factory 1 can supply 100 units per period 100 1 3 8 8 12 200 2 10 16 8 5 150 3 Total supply capacity per period 450 80 90 120 160 Demand 450 Total demand per period Warehouse B can use 90 units per period
Special Problems • Unequal supply and demand • Dummy: Imaginary number added equal to the difference between supply and demand when these are unequal