Download
1 / 33
340 likes | 567 Views
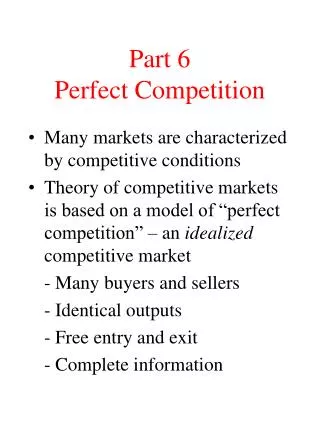
PERFECT COMPETITION (OPTIMAL PRODUCTION IN A PERFECT COMPETITIVE MARKET). STUDY UNIT 9 PRESCRIBED BOOK CHAPTER 12. SOME OF THE STUDY OBJECTIVES. Define and indicate what the characteristics of a perfect competitive market are Explain the demand curve of under perfect competition

E N D
PERFECT COMPETITION(OPTIMAL PRODUCTION IN A PERFECT COMPETITIVE MARKET) STUDY UNIT 9 PRESCRIBED BOOK CHAPTER 12
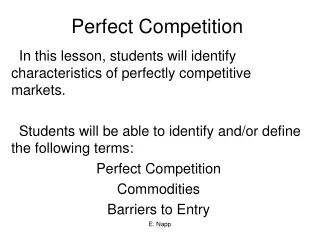
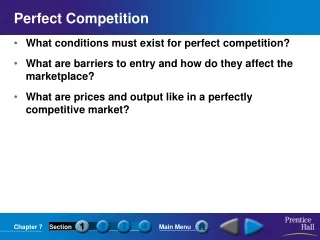
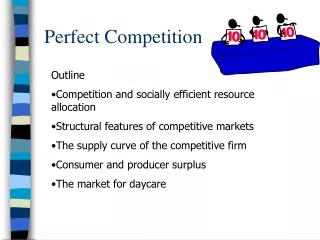
SOME OF THE STUDY OBJECTIVES • Define and indicate what the characteristics of a perfect competitive market are • Explain the demand curve of under perfect competition • Draw the demand curve for a single firm under perfect competition • Determine where profit is maximised in the short-term • Indicate whether a firm records economic profit, normal profit or an economic loss graphically • Determine the shut-down/open-up point.
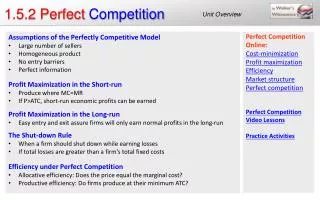
CHARACTERISTICS OF A PERFECT COMPETITIVE MARKET DEFINITION: Perfect competition occurs when none of the individual market participants (buyers & sellers) can influence the price of the product. - They are price takers and quantity adjusters. REQUIREMENTS: • Large number of buyers and sellers • No collusion between sellers – each one acts independently • Homogeneous (identical) product is sold • Freedom of exit and entry to the market • Perfect information • No government intervention • Production factors are mobile
Individual demand curve for the firm D S D=AR=MR=P
Figure 12-1 The demand curve for the product of the firm under perfect competition
PROFIT POSITION IN THE SHORT-TERM • Determine profit in short-term according to: • Total approach (not prescribed) - Firm produces where profit (TR – TC) is the highest • Shut-down (start-up) rule (prescribed book p 227) – Revenue: TR = or greater than TVC; Unit Costs: AR (p) = or greater than AVC • Marginal Approach (the profit-maximising rule) • MR = MC • Differentiate between: • Economic profit • Normal Profit • Economic loss
MARGINAL APPROACH GRAPHICALLY Profit decreases MC>MR Profit maximised MR=MC Profit increases MR>MC
Figure 12-5 Marginal revenue and marginal cost of a firm operating in a perfectly competitive market
PROFIT AND LOSS POSITIONS • Economic profit: • P > minimum of AC • TR > TC • MR > MC • Normal Profit • P = minimum of AC • TR = TC • MR = MC • Economic loss • P < minimum of AC • TR < TC • MR < MC • Market supply curve –figure 12.7 (see later)
SHORT TERM EQUILIBRIUM POSITIONS OF THE FIRM – AN ECONOMIC PROFIT AC E M
SHORT TERM EQUILIBRIUM POSITIONS OF THE FIRM – NORMAL PROFIT AC E
SHORT TERM EQUILIBRIUM POSITIONS OF THE FIRM – AN ECONOMIC LOSS AC M E
Figure 12-6 Different possible short-run equilibrium positions of the firm under perfect competition
THE FIRM’S SUPPLY CURVE C B A
CHANGES IN THE LONG RUN IF THE FIRM RECORDS AN ECONOMIC PROFIT IN SHORT RUN MC S D AC E E MR S1 E1 E1 MR1
CHANGES IN THE LONG RUN IF THE FIRM RECORDS AN ECONOMIC LOSS IN SHORT RUN MC S1 D AC E1 E1 MR1 S E E MR
EXPLAINWHY UNDER PERFECT COMPETITION THE INDIVIDUAL FIRM IS FACED BY A PERFECT ELASTIC DEMAND CURVE S D D Firm Market
DRAW A GRAPH THAT INDICATES WHERE THE PERFECT COMPETITIVE FIRM IS MAKING NORMAL PROFIT IN THE SHORT RUN.
SHORT TERM EQUILIBRIUM POSITIONS OF THE FIRM – NORMAL PROFIT AC E
EXAM QUESTIONS SHORT-RUN EQUILIBRIUM K G C H A
QUESTION RELATING TO SLIDE 25 • Curve H represents which curve? • Name curve K? • At which quantity is profit maximised? • What does the price line represent? • The short-run supply curve of the firm is from? • Is this firm earning an economic profit, normal profit or economic loss? • What does the vertical distance between curve H and G represent?
QUESTION RELATING TO SLIDE 27 • Name the 2 curves? • Illustrate an economic loss on the graph with the aid of a shaded area?
SHORT TERM EQUILIBRIUM POSITIONS OF THE FIRM – AN ECONOMIC LOSS AC M E
Examination questions • What is the profit maximising rule for the firm in a perfectly competitive market which applies the marginal approach? • When will a firm increase production according to the marginal approach? • When will a firm reduce its production using the marginal approach?
THE FIRM’S SUPPLY CURVE C B A
Questions Relating to slide 31 • What is the firm's profit-maximising daily output? • What is the total daily revenue of the profit-maximising firm? • Total daily costs to the firm is? • At which price will it be immaterial for the firm if it shuts down or continues production? • At what point will the firm minimize its economic loss? • What will the firm earn at a price of R20? Briefly explain why? • Briefly explain the concept break even. Also indicate at which corresponding point on the figure this situation will occur.
Questions Relating to slide 31 • The vertical distance between AC and AVC represents? • What part of the firm's MC curve can be regarded as the firm's supply curve?