Download
1 / 36
420 likes | 1.23k Views
Chapter 8 Atmospheric Circulation and Pressure Distributions. George Hadley (1685-1768) proposed a simple circulation pattern called the single-cell model to describe the general movement of the atmosphere.

E N D
Chapter 8 Atmospheric Circulation and Pressure Distributions
George Hadley (1685-1768) proposed a simple circulation pattern called the single-cell model to describe the general movement of the atmosphere. In the single-cell model, air expands upward, diverges toward the poles, descends, and flows back toward the equator near the surface. Winds blowing east-to-west or west-to-east are zonal winds; those moving north-to-south or south-to-north are meridional.
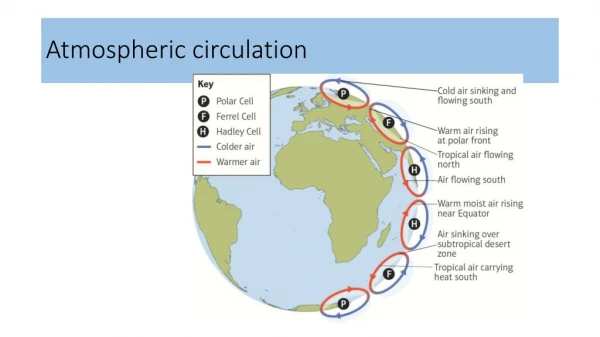
The three-cell model divides the circulation of each hemisphere into three distinct cells: the heat-driven Hadley cell that circulates air between the Tropics and subtropics, a Ferrel cell in the middle latitudes, and a polar cell.
Along the equator, strong solar heating causes air to expand upward and diverge toward the poles, creating a zone of low pressure called the equatorial low or the Intertropical Convergence Zone. The ITCZ is the rainiest latitude zone in the world and is observable as the band of convective clouds and showers extending from northern South America into the Pacific on this satellite image.
Global precipitation from satellite SACZ South Pacific convergence Zone South Atlantic Convergence Zone
At about 20° to 30° latitude, air in the Hadley cell sinks toward the surface to form the subtropical highs, large bands of high surface pressure. Cloud formation is greatly suppressed and desert conditions are common in the subtropics. In the Northern Hemisphere, as the pressure gradient force directs surface air from the subtropical highs to the ITCZ, the weak Coriolis force deflects the air slightly to the right to form the northeast trade winds. In the Southern Hemisphere, the northward-moving air from the subtropical high is deflected to the left to create the southeast trade winds.
Flanking the Hadley cell in each hemisphere is the Ferrel cell, which circulates air between the subtropical highs and the subpolar lows, or areas of low pressure. On the equatorial side of the Ferrel cell, air flowing poleward from the Northern Hemisphere subtropical high undergoes a substantial deflection to the right, creating a wind belt called the westerlies. In the Southern Hemisphere, the pressure gradient force propels air southward, but the Coriolis force deflects it to the left, producing a zone of westerlies in that hemisphere as well.
In the polar cells of the three-cell model, surface air moves from the polar highs to the subpolar lows. Compared to the poles, air at subpolar locations is slightly warmer, resulting in low surface pressure and rising air. Very cold conditions at the poles create high surface pressure and low-level motion toward the equator. In both hemispheres, the Coriolis force turns the air to form a zone of polar easterlies in the lower atmosphere.
In the real world we find a number of alternating semi-permanent cells of high and low pressure. Among the most prominent features in the Northern Hemisphere during winter are the Aleutian and Icelandic Lows over the Pacific and Atlantic Oceans, and the Siberian High over central Asia.
In summer of the NH, the best-developed semi-permanent cells are the Hawaiian and Bermuda-Azores Highs of the Pacific and Atlantic Oceans and the Tibetan Low of southern Asia.
The Sahel is a region of Africa bordering the southern Sahara Desert. During the summer (left), the ITCZ usually shifts northward and brings rain to the region. For much of the year, the ITCZ is located south of the Sahel, and the region receives little or no precipitation (right).
High level winds Wind speeds generally increase with height between the surface and the tropopause because pressure gradient force is typically stronger at high altitudes. The surfaces representing the 900, 800, and 700 mb levels all slant downward to the north, but not by the same amount. Higher surfaces slope more steeply because the pressure gradient force is greater.
The polar front is a strongly sloping boundary between warm mid-latitude air and cold polar air. Within the front, the slope of the pressure surfaces increases greatly because of the abrupt horizontal change in temperature. With steeply sloping pressure surfaces there is a strong pressure gradient force, resulting in the polar jet stream situated above the polar front near the tropopause.
Jet streams can be thought of as meandering “rivers” of air, usually 9 to 12 km above sea level. Their wind speeds average about 180 km/hr in winter and about half that in summer, though peak winds can exceed twice these values. Nearer the equator is the subtropical jet stream, associated with the Hadley cell. The subtropical jet stream can bring with it warm, humid conditions as seen above.
S N This hypothetical drawing of the 500 mb surface reveals that heights decrease from south to north but also rise and fall through the ridges and troughs. Vertical changes are highly exaggerated in the figure. Actual height changes are small compared to the size of the continent.
Troughs occur in the middle troposphere where the 500 mb height contours dip equatorward. In the top map, positions 1–3 have the 500 mb level at 5610 m. To the south, at positions 4–6, the 500 mb level is at 5640 m. In the bottom map, contour lines shift equatorward over the central portion of the continent. Thus, positions 2 and 5 have lower pressure than the areas east and west of them. The zone of lower pressure over the central continent is a trough.
There are anywhere from three to seven Rossby waves or long waves circling the globe, each with a particular wavelength and amplitude. Rossby waves often remain in fixed positions, but also migrate west to east and are capable of transporting warm air from subtropical regions to high latitudes, or cold polar air to low latitudes.
Ocean currents are horizontal movements of surface water that have an impact on the exchange of energy and moisture between the oceans and the lower atmosphere. Among these are the North Equatorial Current and the South Equatorial Current,which converge, creating the Equatorial Countercurrent. The warm Gulf Stream flows northeast tobecome the North Atlantic Drift and later the cold Canary Current as it turns southward. The cold Labrador Current flows south along the east coast of Canada fed by the East and West Greenland Drift.
Ocean currents are driven by winds in the lower atmosphere that exert a drag on the water at an angle 45° to the right (Northern Hemisphere) and continue to shift clockwise as their speed decreases. At a depth of about 100 m, the current approaches the opposite direction of the surface current and begins to die out in a pattern known as the Ekman spiral.
Strong offshore winds along a coastal region sometimes drag warmer surface waters seaward drawing up cooler waters from below to take their place in a process known as upwelling, whichgreatly influences sea surface temperatures over the eastern portions of the major oceans.
Global, synoptic, mesoscale and microscales Features such as the Intertropical Convergence Zone, the westerlies, and large Rossby waves exist on a global scale. Smaller features, such as cyclones, anticyclones, troughs, and ridges, exist at the synoptic scale, covering hundreds or thousands of square kilometers. Mesoscale events are on the order of tens of square kilometers and last for periods as brief as half an hour. The smallest exchanges of mass and energy operate at the microscale.
Foehn is the generic name for synoptic scale winds that flow down mountain slopes, warm by compression, and introduce hot, dry, and clear conditions to the adjacent lowlands. Winds warmed by compression that descend the eastern slopes of the Rocky Mountains are called chinooks. The Santa Ana winds of California, common in the fall and spring, occur when high pressure develops over the Rocky Mountains. Katabatic winds originate when air is locally chilled over a high- elevation plateau and warmed by compression as it flows down slope.
A valley breeze (a) forms when daytime heating causes the mountain surface to become warmer than nearby air at the same altitude. The air expands upward and the air flows from the valley to replace it. Nocturnal cooling makes the air dense over the mountain and initiates a mountain breeze (b).
Along the coast during the daytime, land surfaces warm more rapidly than the adjacent water (a), which causes the air column overlying the land to expand and rise upward (b). At a height of about 1 km, the rising air spreads outward (c) causing an overall reduction in the surface air pressure. Over the adjacent water less warming takes place, so the air pressure is greater than that over land. The air over the water moves toward the low-pressure area over the land, which sets up the daytime sea breeze. At night the land surface cools more rapidly than the water. The air over the land becomes dense generating a land breeze.
The Walker circulation is an east-west circulation pattern of the Tropics, characterized by several cells of rising and sinking air connected by horizontal motions along parallel lines of latitude. The circulation involves a westward flow of surface air over the equatorial Pacific, which drags warm surface waters into the western Pacific. When the westerly flow weakens or reverses, the warm waters to the west migrate eastward and cause an El Niño.
At 2- to 7-year intervals, surface waters of the eastern Pacific, especially near Peru, become unusually warm. An El Niño develops when the trade winds weaken or reverse and flow eastward. The warm water normally found in the western Pacific gradually “sloshes” eastward as a slow moving wave toward the coasts of North and South America. The eastern Pacific warms, upwelling weakens, and the warm surface layer deepens throughout the tropical Pacific basin.
The change in sea surface conditions linked with the change in the atmospheric pressure distribution is called the Southern Oscillation. The El Niño and Southern Oscillation are closely intertwined and atmospheric scientists refer to their combined occurrences as ENSO events. When an El Niño dissipates, it can be followed either by a return to normal sea surface conditions, or by further cooling of the tropical eastern Pacific. The resultant pattern, the reverse of an El Niño, is called a La Niña.
Average sea surface temperature differences from normal during the November through March period for eight El Niño episodes.
Average sea surface temperature differences from normal during the November through March period for eight La Niña episodes.
Certain weather conditions in the eastern U.S. are set up through teleconnections, the relationships between weather or climate patterns at two widely separated locations. El Niños favor the formation of ridge-trough patterns that bring rainy conditions to the southeastern U.S. and mild, dry conditions to the northeastern U.S. and eastern Canada.
Worldwide climatic conditions associated with the occurrence of El Niño.
Worldwide climatic conditions associated with the occurrence of La Niña.
The Pacific Decadal Oscillation is a pattern in which two primary nodes of sea surface temperature exist, a large one in the northern and western basin, and a smaller one in the eastern tropical Pacific. At periods ranging from about 20 to 30 years, sea surface temperatures in the two zones undergo fairly abrupt shifts. The PDO Index is a commonly used indicator of the strength and mode of the Pacific Decadal Oscillation.
The Arctic Oscillation alternates between a warm phase and a cold phase in sea surface temperatures. During the warm phase, there is relatively low pressure over polar locations and higher pressure at lower latitudes. During the cold phase, higher pressure dominates over the pole, with lower pressure in the central Atlantic. It is closely related to another observed pattern called the North Atlantic Oscillation.
The next chapter examines air masses and fronts.