Download
1 / 38
380 likes | 510 Views
Current State of PM-Monitoring in North Rhine-Westphalia. Dr. Klaus Vogt Air Quality Monitoring Network State Agency for Nature, Environment and Consumer Protection of North Rhine – Westphalia (LANUV). Current State of PM10-Monitoring. A: Choice of PM measurement stations

E N D
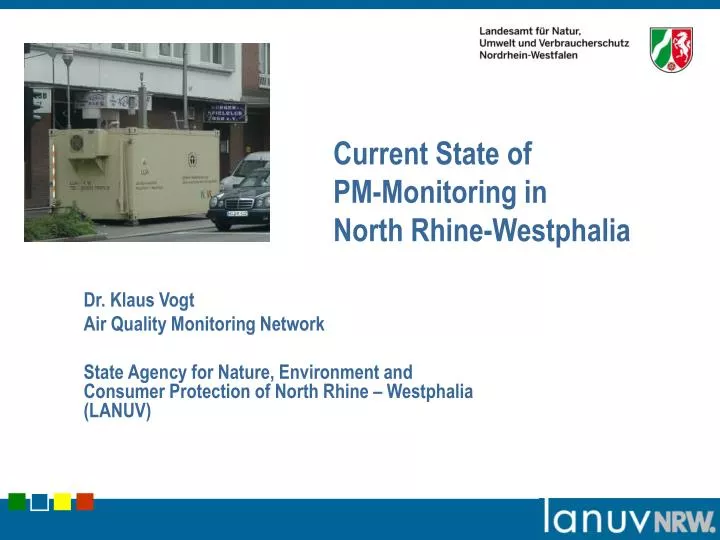
Current State ofPM-Monitoring in North Rhine-Westphalia Dr. Klaus Vogt Air Quality Monitoring Network State Agency for Nature, Environment and Consumer Protection of North Rhine – Westphalia (LANUV)
Current State of PM10-Monitoring • A: Choice of PM measurement stations • B: Equipment – calibrations – future trends • C: Data aquisition – data handling • D: Spatial interpolation of point data • E: Forecast Modelling • LANUV is responsible for Air Quality Monitoring and Assessment throughout NRW
A: Choice of Measurement Sites • Long term monitoring network • Legal requirements • Repetition measurements • External requests • Internet-Screening • a bundle of aspects from different points of view
A1: Legal Aspects • Air Quality Directive 1999/30/EC – Federal Emission Law (BImSchG) • Air Quality Directive 2008/50/EC – national law in preparation • Minimum requirements, depending on zoning, population and lower/upper assessment thresholds
Zones and agglomerations established in NRW; minimum requirements for PM measurements
Measurement sites Minumum requirement of sampling sites (Annex V, extract) • Urban background and traffic:for NO2, PM, CO, Benzene at least one station each • Industrial sources: due to exposition and emission density, spatial distribution • Ecosystems 1 per 20.000 km² 1 per 40.000 km²
A2: Repetition Measurements 15 mobile containers (max. 2x2 m) within the network • Rotating principle with available ressources: First Measurements (Year 1) When exceedance of limit value: Air Quality Plan (Year 2-3) Measures (Year 3 ff) Controll Measurement (Year 4) • No longer feasible according to regulations in 2008/60/EC: immobilisation of measurement sites when exceeding limit values
A3: External requests • Ministries (Environment, Economy, Health...) • 5 Regional Governments in NRW (Köln, Düsseldorf...) • 396 Municipalities (see below: Internet-Screening) • NGO´s • Citizen´s initiatives
A4: Internet-Screening • Searching for suspicious traffic hot spots via a simplified dispersion modell • Cooperation with city agencies for environment via an internet tool • Basis for measurement request • Cities can find and calculate their own hot spots
Searching for hot spots: Reduced modell tool (IMMISweb) for cities via internet application (IMMIS dispersion modell by IVU Freiburg) Calculation of PM and other components in street canyons, using reduced data on traffic and building geometry Air Quality Sreening NRW http://www.lanuv.nrw.de/luft/ausbreitung/luft_screening.htm http://www.ivu-umwelt.de/front_content.php?idcatart=86#luft2
Procedure for site planning and decision • Collecting and plausibility testing of ideas / requests / options /ressources • Inspection of preselected sites (problems, technical feasability...) • LANUV monitoring programme meeting in September • Report to Ministry and Regional Governments, asking for improvement proposals • Decisions in October • Preparation of measurement sites from October / January • Start of mesurement between 15.12. and 15.01. • Presentation of monitoring programme on internet
The Monitoring Network in NRW 72 sites, including 15 traffic sites and 9 industrial hot spots in 2009 • Main continuous measurements: • - 64 x PM10 + PM2.5 • - 62 x NO2 • - 19 x SO2 • - 32 x Ozone • Main continuous measurements: • - 42 x PM10 + PM2.5 • - 74 x NO2 passive samplers • (incl. metal and PAH analysis) stationtypes background forest industry traffic
Types of Stations Background Industry Traffic Forest
B: PM-Equipment – Calibration – Future Trends • Current Equipment: PM10: FH62 IR (14) TEOM SES (29) (101) TEOM FDMS (17) SHARP (5) Digitel DHA 80 (35) Derenda LVS3 (1) PM 2,5: TEOM FDMS (5) SHARP (6) (24) Leckel SEQ47/50 (12) Derenda LVS3 (1) • Trends: less devices: FH62 IR, DERENDA LVS3, TEOM FDMS more devices: Digitel DHA 80 safety reasons: PM2.5 AEI-Network gravimetric (ongoing testing in laboratory and field with SHARP and BAM)
PM calibration procedure • Parallel measurement at 20 sites with gravimetric reference method and continuously measuring device • Yearly statistical analysis of all data in February (RIVM spreadsheet tests , calibration factors ...) • Determination of calibration factors for different types of PM devices for the past year, using them as provisional factors for the ongoing year (sometimes individual factor for special sites) Example 2009: 1. TEOM-FDMS (B,C und CB): * Faktor 1,13 2. TEOM-SES: * Faktor 1,28 3. FH62: * Faktor 1,28 4. SHARP: * Faktor 1,06 http://www.lanuv.nrw.de/luft/immissionen/ber_trend/erlaeuterungen2008.pdf
C: Data aquisition – data handlingMeasuring Systems for Air Quality Monitoring Automated measuring systems Online data PM-measurements (analysis in lab) Daily values Measurements for lab analysis Daily + monthly values Task Force In-site-analysis • SO2 • NO und NO2 • Particulate Matter: Total and PM10 / PM 2.5 • Ozone O3 • Meteorological Parameters • e.g. direction and velocity of wind, air temp, pressure etc. • Compounds of PM (total and fractions PM10 / PM 2.5 • Lead • Cadmium • Nickel • Arsenic • Chromium • Iron • Zinc • Antimon • Benzo[a]pyrene • Deposition of PM incl. metallic compounds • Soot • Benzene and other hydrocarbons • Polychlorinated Biphenyles (PCB) • Polyhalogenated Dibenzodioxines und Dibenzofuranes • Major spectrum of organic and inorganic compounds analyzed be special equipment: • Continuous measuring • Mobile GC/MS • Mobile XREM with EDX • Sensors and testtubes • Meteorologic devices • Sampling equipment • Protective equipment for working in danger zones
Mobile station Fixed station Laboratory analytik LUQS-Central Office LANUV NRW Essen IT NRW worldwide User... ...or direct connected computer
Data flow for PM10 telemetric online measurements Station: PM data in a frequence of 5 sec to 6 min aggregation to 0.5h-values and 24h-values transfer via ISDN telephone line by automatic active query Central data base: formal controls, calibration factor transfer to internet and videotext as 24h-moving average validation procedures (formal and professional) Storage in central data base internet presentation as validated daily values and exceedance day table Yearly analyses with additional PL-controls and calibration factors internet presentation as validated monthly and yearly values and exceedance days
D: Spatial Interpolation of PM point data • EURAD-FLADIS NRW: a combination of modell results by EURAD (RIU Köln) with measurement data at background stations in the NRW monitoring network (LUQS) (“calibration of model results with measured data by data assimilation”) • analysis and vizualisation of spatial data for different components and years (status and prognosis) • Use as background data e.g. for the internetscreening (see above) http://www.ivu-umwelt.de/front_content.php?idcatart=89#fladis1
E: Forecast modelling in NRW • EURAD Modell of RIU Köln: European Dispersion and Deposition Modell (used by UBA, NRW, BW) • Regional chemical aerosol transport model • nested, horizontal resolution up to 1 km x 1 km • four modules: meteorology (MM5), emissions (EE5), aerosols (MADE), chemistry (CTM) • Forecast of immission on regional scale Ozone, SO2, NO2, PM, CO, Benzene • Additionally: modelling of annual averages regional background values for, e.g., clean air plans N0: Europe 125 km x 125 km N1: Germany, 25 km x 25 km N2: NRW, 5 km x 5 km
E: Forecast modelling in NRW, case studies (HERMINE) • Sensitivity studies for contribution of emission sources to the background concentration of PM10, PM2.5, NO2 for 2006, with • - actual emissions / basic case - no anthropogenic emissions in Germany- anthropogenic emissions only in NRW -no anthropogenic emissions in NRW - no gaseous emissions in NRW- no industrial emissions in NRW - no car emissions in NRW
E: Forecast modelling in NRW, case studies (HERMINE) One Result: PM10 NRW Yearly Average in µg/m³ 2006 Basic case no road traffic in NRW no industry in NRW
Mini-Container für Measurements at traffic hot spots Mini-Container (1.2 x 2.0 m) Example: Street canyon at B224 in Essen
Measurement at the motorway A40 in Essen Container
Lignite Pit Hambach Area of Clean Air Plan Area for Calculation
Source Apportionment at Point of Exceedance • total concentration (point of exceedance) • total background concentration, urban background concentration • regional background concentration NO2, PM10 industry (steel works) traffic (urban canyon) regional background concentration
Gravimetric Method PM10 Zum Filter
Continuous Measurement PM10 (I) Oscillating Microballance
Continuous Measurement PM10 (II) • b-Absorption:
PM10-exceedances (daily mean) 2008 Background sites Industrial sites Forrest sites
PM10-exceedances (daily mean) 2008 Traffic sites
Subunit 42 LANUV: Air Quality Monitoring - Assessment and Information • Running of continuously working Monitoring network • Interpretation and assessment • Online data transfer (Internet, Videotext) • Preparation of reports…. • Validation of measured results, comparison with limit values, interpretation of trends, effect-control of measures concerning air quality, reactions to requests, consultance of citizens by telephone • Lectures and speeches • Coordination of Clean-Air-Plan activities inside department 4