Download
1 / 1
10 likes | 130 Views
Peculiar behavior of tropopause observed in tropical and extra tropical latitudes with CHAMP/GPS Radio Occultation measurements M. Venkat Ratnam and T . Tsuda Research Institute for Sustainable Humanosphere(RISH),Kyoto University, Uji 611 0011, JAPAN

E N D
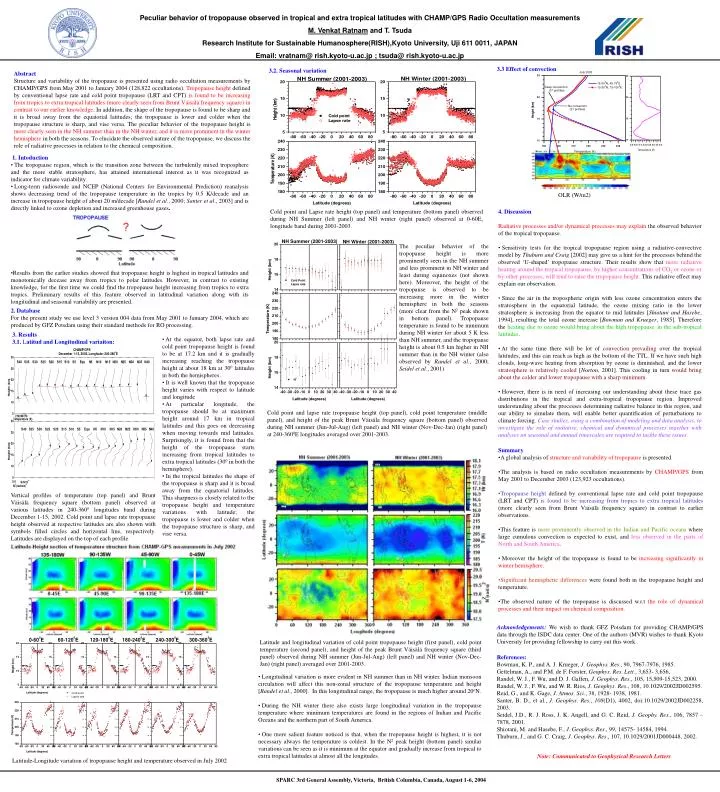
Peculiar behavior of tropopause observed in tropical and extra tropical latitudes with CHAMP/GPS Radio Occultation measurements M. Venkat Ratnam and T. Tsuda Research Institute for Sustainable Humanosphere(RISH),Kyoto University, Uji 611 0011, JAPAN Email: vratnam@ rish.kyoto-u.ac.jp ; tsuda@ rish.kyoto-u.ac.jp 3.3 Effect of convection 3.2. Seasonal variation Abstract Structure and variability of the tropopause is presented using radio occultation measurements by CHAMP/GPS from May 2001 to January 2004 (128,822 occultations). Tropopause height defined by conventional lapse rate and cold point tropopause (LRT and CPT) is found to be increasing from tropics to extra tropical latitudes (more clearly seen from Brunt Väisälä frequency square) in contrast to our earlier knowledge. In addition, the shape of the tropopause is found to be sharp and it is broad away from the equatorial latitudes; the tropopause is lower and colder when the tropopause structure is sharp, and vise versa. The peculiar behavior of the tropopause height is more clearly seen in the NH summer than in the NH winter, and it is more prominent in the winter hemisphere in both the seasons. To elucidate the observed nature of the tropopause, we discuss the role of radiative processes in relation to the chemical composition. • 1. Intoduction • The tropopause region, which is the transition zone between the turbulently mixed troposphere and the more stable stratosphere, has attained international interest as it was recognized as indicator for climate variability. • Long-term radiosonde and NCEP (National Centers for Environmental Prediction) reanalysis shows decreasing trend of the tropopause temperature in the tropics by 0.5 K/decade and an increase in tropopause height of about 20 m/decade [Randel et al., 2000; Santer et al., 2003] and is directly linked to ozone depletion and increased greenhouse gases. • Results from the earlier studies showed that tropopause height is highest in tropical latitudes and monotonically decease away from tropics to polar latitudes. However, in contrast to existing knowledge, for the first time we could find the tropopause height increasing from tropics to extra tropics. Preliminary results of this feature observed in latitudinal variation along with its longitudinal and seasonal variability are presented. OLR (W/m2) Cold point and Lapse rate height (top panel) and temperature (bottom panel) observed during NH Summer (left panel) and NH winter (right panel) observed at 0-60E, longitude band during 2001-2003. • 4. Discussion • Radiative processes and/or dynamical processes may explain the observed behavior of the tropical tropopause. • Sensitivity tests for the tropical tropopause region using a radiative-convective model by Thuburn and Craig [2002] may give us a hint for the processes behind the observed ‘U-shaped’ tropopause structure. Their results show that more radiative heating around the tropical tropopause, by higher concentrations of CO2 or ozone or by other processes, will tend to raise the tropopause height. This radiative effect may explain our observation. • Since the air in the tropospheric origin with less ozone concentration enters the stratosphere in the equatorial latitude, the ozone mixing ratio in the lower stratosphere is increasing from the equator to mid latitudes [Shiotani and Hasebe, 1994], resulting the total ozone increase [Bowman and Krueger, 1985]. Therefore the heating due to ozone would bring about the high tropopausein the sub-tropical latitudes. • At the same time there will be lot of convection prevailing over the tropical latitudes, and this can reach as high as the bottom of the TTL. If we have such high clouds, long-wave heating from absorption by ozone is diminished, and the lower stratosphere is relatively cooled [Norton, 2001]. This cooling in turn would bring about the colder and lower tropopause with a sharp minimum. • However, there is in need of increasing our understanding about these trace gas distributions in the tropical and extra-tropical tropopause region. Improved understanding about the processes determining radiative balance in this region, and our ability to simulate them, will enable better quantification of perturbations to climate forcing. Case studies, using a combination of modeling and data analysis, to investigate the role of radiative, chemical and dynamical processes together with analyses on seasonal and annual timescales are required to tackle these issues. The peculiar behavior of the tropopause height is more prominently seen in the NH summer and less prominent in NH winter and least during equinoxes (not shown here). Moreover, the height of the tropopause is observed to be increasing more in the winter hemisphere in both the seasons (more clear from the N2 peak shown in bottom panel). Tropopause temperature is found to be minimum during NH winter for about 5 K less than NH summer, and the tropopause height is about 0.5 km higher in NH summer than in the NH winter (also observed by Randel et al., 2000; Seidel et al., 2001) 2. Database For the present study we use level 3 version 004 data from May 2001 to January 2004, which are produced by GFZ Potsdam using their standard methods for RO processing. 3. Results 3.1. Latitud and Longitudinal variaiton: • At the equator, both lapse rate and cold point tropopause height is found to be at 17.2 km and it is gradually increasing reaching the tropopause height at about 18 km at 300 latitudes in both the hemispheres. • It is well known that the tropopause height varies with respect to latitude and longitude • At particular longitude, the tropopause should be at maximum height around 17 km in tropical latitudes and this goes on decreasing when moving towards mid latitudes. Surprisingly, it is found from that the height of the tropopause starts increasing from tropical latitudes to extra tropical latitudes (300 in both the hemisphere). • In the tropical latitudes the shape of the tropopause is sharp and it is broad away from the equatorial latitudes. This sharpness is closely related to the tropopause height and temperature variations with latitude; the tropopause is lower and colder when the tropopause structure is sharp, and vise versa. Cold point and lapse rate tropopause height (top panel), cold point temperature (middle panel), and height of the peak Brunt Väisäla frequency square (bottom panel) observed during NH summer (Jun-Jul-Aug) (left panel) and NH winter (Nov-Dec-Jan) (right panel) at 240-3600E longitudes averaged over 2001-2003. • Summary • A global analysis of structure and variability of tropopause is presented. • The analysis is based on radio occultation measurements by CHAMP/GPS from May 2001 to December 2003 (123,923 occultations). • Tropopause height defined by conventional lapse rate and cold point tropopause (LRT and CPT) is found to be increasing from tropics to extra tropical latitudes (more clearly seen from Brunt Väisälä frequency square) in contrast to earlier observations. • This feature is more prominently observed in the Indian and Pacific oceans where large cumulous convection is expected to exist, and less observed in the parts of North and South America. • Moreover the height of the tropopause is found to be increasing significantly in winter hemisphere. • Significant hemispheric differences were found both in the tropopause height and temperature. • The observed nature of the tropopause is discussedw.r.t the role of dynamical processes and their impact on chemical composition. Vertical profiles of temperature (top panel) and Brunt Väisälä frequency square (bottom panel) observed at various latitudes in 240-3600 longitudes band during December 1-15, 2002. Cold point and lapse rate tropopause height observed at respective latitudes are also shown with symbols filled circles and horizontal line, respectively. Latitudes are displayed on the top of each profile. Acknowledgements: We wish to thank GFZ Potsdam for providing CHAMP/GPS data through the ISDC data center. One of the authors (MVR) wishes to thank Kyoto University for providing fellowship to carry out this work. Latitude and longitudinal variation of cold point tropopause height (first panel), cold point temperature (second panel), and height of the peak Brunt Väisälä frequency square (third panel) observed during NH summer (Jun-Jul-Aug) (left panel) and NH winter (Nov-Dec-Jan) (right panel) averaged over 2001-2003. References: Bowman, K. P., and A. J. Krueger, J. Geophys. Res., 90, 7967-7976, 1985. Gettelman, A., and P.M. de F. Forster, Geophys. Res. Lett., 3,653- 3,656, Randel, W. J., F. Wu, and D. J. Gaffen, J. Geophys. Res., 105, 15,509-15,523, 2000. Randel, W. J., F. Wu, and W. R. Rios, J. Geophys. Res., 108, 10.1029/2002JD002595. Reid, G., and K. Gage, J. Atmos. Sci., 38, 1928- 1938, 1981. Santer, B. D., et al., J. Geophys. Res., 108(D1), 4002, doi:10.1029/2002JD002258, 2003. Seidel, J.D., R. J. Ross, J. K. Angell, and G. C. Reid, J. Geophy. Res., 106, 7857 –7878, 2001. Shiotani, M. and Hasebe, F., J. Geophys. Res., 99, 14575- 14584, 1994. Thuburn, J., and G. C. Craig, J. Geophys. Res., 107, 10.1029/2001JD000448, 2002. • Longitudinal variation is more evident in NH summer than in NH winter. Indian monsoon circulation will affect this non-zonal structure of the tropopause temperature and height [Randel et al., 2000]. In this longitudinal range, the tropopause is much higher around 20oN. • During the NH winter there also exists large longitudinal variation in the tropopause temperature where minimum temperatures are found in the regions of Indian and Pacific Oceans and the northern part of South America. • One more salient feature noticed is that, when the tropopause height is highest, it is not necessary always the temperature is coldest. In the N2 peak height (bottom panel) similar variations can be seen as it is minimum at the equator and gradually increase from tropical to extra tropical latitudes at almost all the longitudes. Note: Communicated to Geophysical Research Letters Latitude-Longitude variation of tropopause height and temperature observed in July 2002 SPARC 3rd General Assembly, Victoria, British Columbia, Canada, August 1-6, 2004