Download
1 / 35
350 likes | 492 Views
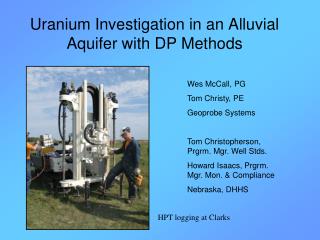
Uranium Investigation in an Alluvial Aquifer with DP Methods. Wes McCall, PG Tom Christy, PE Geoprobe Systems Tom Christopherson, Prgrm. Mgr. Well Stds. Howard Isaacs, Prgrm. Mgr. Mon. & Compliance Nebraska, DHHS. HPT logging at Clarks. Why ?.

E N D
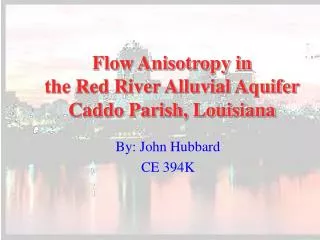
Uranium Investigation in an Alluvial Aquifer with DP Methods Wes McCall, PG Tom Christy, PE Geoprobe Systems Tom Christopherson, Prgrm. Mgr. Well Stds. Howard Isaacs, Prgrm. Mgr. Mon. & Compliance Nebraska, DHHS HPT logging at Clarks
Why ? EPA Radionuclides Rule amendment establishes MCL for Uranium at 30 ug/l (mass) GWMR Vol. 29, No. 1, pp 42-44 Winter 2009 Salina Journal April 24, 2008 Page A5 Salina, KS
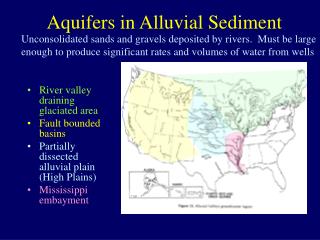
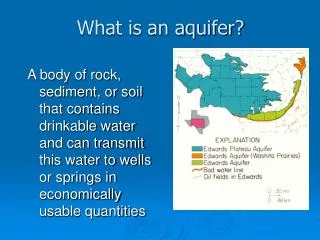
Where ? Village of Clarks Merrick County, NE Alluvial deposits of the Platte River Local bedrock is the Niobrara Chalk. Nebraska Geologic Bedrock Map after Burchett & Pabian, 1991.
Background on Clarks PWS Wells • Old, shallow wells in town abandoned due to natural Uranium between 100-200ug/L • Two new, deeper PWS wells installed outside of town after test wells indicate U nondetect • New north PWS well exceeds U MCL at initial sampling event • Short time later south PWS well exceeds U MCL New Clarks PWS South
PWS 4” Test New Wells Concrete Bentonite Seal Depth (feet) South PWS well and 4” test well construction based on drillers logs Gravel Pack psi
How ? • Hypothesis: Elevated oxygen in zone(s) of aquifer leading to dissolution of Uranium into the groundwater • HPT logging for hydrogeology • HPT logs guide well placement • Install wells using DP methods • Develop wells • Low flow sampling - DHHS • Nebraska DHHS Lab analysis Geoprobe Model 8040 advances 2.25” rods for DP well installation
Hydraulic Profiling Tool (HPT) Logs Geoprobe 6625 Unit advanced HPT probe to obtain logs
Water HPT Operational Theory • Hammer or push probe at constant rate (2cm/sec) • Inject water at low flow rate (~300ml/min) • Measure injection pressure with in-line transducer Flow
HPT Probe E-log Wenner Array Injection Screen
Basics of an HPT Log (South PWS Well) EC Flow Pressure • Electrical Conductance – EC (mS/m) • Higher EC >>> clay • Lower EC >>> sand/gravel • Pressure (psi /100 max) • Higher P >>> lower perm • Lower P >>> higher perm • Hydrostatic P >>> rising baseline • Flow (ml/min) --- ~ constant • Higher flow >>> higher perm • Lower flow >>> lower perm Depth (ft)
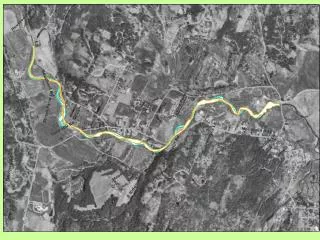
Site Sketch Map N 4” Test Well North PWS Well North (Inactive) C2 PWS wells are ~500ft apart DP wells separated by ~5 ft B1B2B3B4B5 PWS Well South (Pumping) HPT log locations A4A3A2A1 DP Wells 4” Test Well South Gravel Pad C1 (not to scale)
C1 C2 HPT Cross Section C1-C2 Looking NW Presence and thickness of silt-clay layers varies vertically and laterally across the area. Most clay layers are not continuous.
Selected Screen IntervalsA-Group Wells A4 = 33-38 Use HPT logs to guide screen interval selection. Lower Pressure intervals = sand & gravel. A3 = 55-60 Depth (ft) A2 = 75-80 Target sand layers between larger clay layers/lenses A1 = 103-108 Pressure (psi)
Selected Screen Intervals B-Group Wells B5 = 15-20 B4 = 35-40 Does ground water chemistry change with depth? DO? ORP? Uranium ? Cations & Anions? Depth (ft) B3 = 65-70 B2 = 83-88 B1 = 105-110 Pressure (psi)
Setting the DP Wells Drive Cap (ASTM D6725) O-Ring Seals Probe Rod (2.25” OD x 1.5” ID) Expendable/Anchor Point
Protector DP Well Construction 25% solids bentonite grout ¾” PVC Grout barrier: fm natural collapse Nominal ¾” Prepacked Screen x 5ft (not to scale) Tremie Grouting
DP Well Initial Development Development with Check Valve Set within Screen Check valve Early purge water
Final Development : with Mechanical Bladder Pump Monitor Water Quality Parameters Low Flow Sampling with Mechanical Bladder Pump
Site Sketch Map N 4” Test Well North PWS Well North (Inactive) C2 DP wells separated by ~5 ft B1B2B3B4B5 PWS Well South (Pumping) HPT log locations A4A3A2A1 DP Wells 4” Test Well South Gravel Pad C1 (not to scale)
A-Group & South 4” Well A4 Sp Cnd = 1043 uS/cm A3 Sp Cnd = 698 A2 Sp Cnd = 530 S4” Sp Cnd = 1115 A1 Sp Cnd = 405 DO < 0.1 mg/l all wells ORP ~ -200 to -300 mV all DP wells
B-Group & N. 4” Well B5 Sp Cnd = 770 DO < 0.1 mg/l all wells ORP ~ -200 to -350 mV all wells B4 Sp Cnd = 805 B3 Sp Cnd = 795 N4” B2 Sp Cnd = 605 Sp Cnd = 885 uS/cm B1 Sp Cnd = 372 Where’s the DO ?
A-Group & S. 4” WellsUranium Data (ug/L) A4 U = 32.2 A3 U = 15.1 A2 U = < 1 S4” U = 168 A1 U = < 1
B-Group & N. 4” WellsUranium Data (ug/L) B5 U = 15.1 B4 U = 98.7 B3 U = 376 N4” B2 U = 1.3 U = 124 B1 U = 1.8
South PWS & 4” Test Well Construction With HPT Log Both filter packs penetrate low permeability layers allowing for “short circuiting” Filter packs behave as a preferential flow path. U = 98.7 ug/l U = 376 ug/l Low permeability layer(s) U = ND
Summary - Conclusions • HPT logs provide detailed information on hydrogeology • DP wells yield discrete interval samples for water quality assessment • Uranium can be mobile in low DO and low ORP environments … dependent on water chemistry • Uranium distribution at this site is heterogeneous in vertical and horizontal dimensions • Investigate before Investing Uranium?
But … Why is Uranium Mobile here? NE DHHS Team samples DP wells with Mechanical Bladder Pump Low DO and Low ORP … DO < 0.1 mg/l in all wells ORP ranges from ~ -200 to -300mV Uranium geochemistry indicates it should be reduced (U+4) and form insoluble precipitates (Pitchblende/Urananite)
Increase in pCO2lowers ORP (Eh) at which U+4 oxidizes to U+6 Sufficient CO2 will lower this to < -300mV Iron and Manganese can behave as electron acceptors for U+4 oxidation to U+6 Available Calcium can result in formation of soluble Ca-U-CO3 complexes
Geochemistry at the Clarks Well Field … Geochemistry in the local aquifer is consistent with having uranium in solution even with low DO and Low Eh conditions observed.
A-Group & S. 4” WellsSodium & Sulfate (mg/L) A4 Na = 98.1 SO4 = 239 A3 Na = 43.7 SO4 = 121 A2 Na = 39.8 SO4 = 113 S4” Na = 107 SO4 = 257 A1 Na = 22.1 SO4 = 46.4
B-Group & N. 4” WellSodium & Sulfate (mg/L) B5 Na = 56.8 SO4= 136 B4 Na = 66.8 SO4 = 180 B3 Na = 72.9 SO4 = 160 N4” B2 Na = 45.7 SO4 = 149 Na = 67.9 SO4 = 170 B1 Na = 29.4 SO4 = 98.7