Download
1 / 36
380 likes | 589 Views
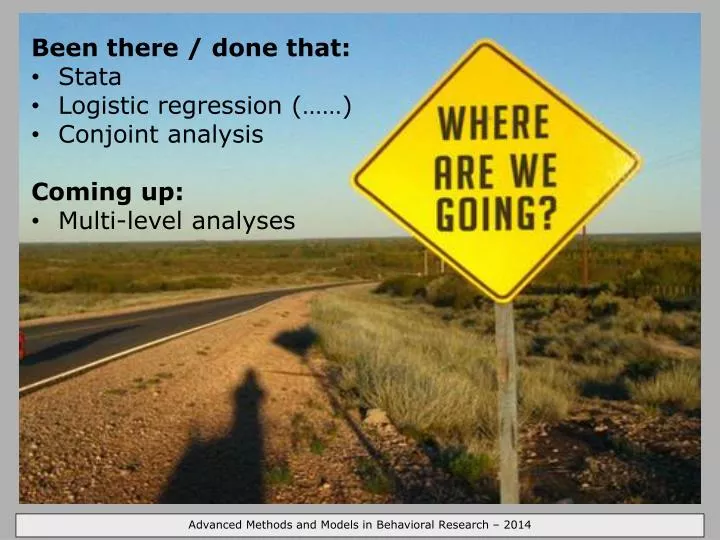
Been there / done that: Stata Logistic regression (……) Conjoint analysis Coming up: Multi-level analyses. AMMBR course design. CONTENT METHOD. Y is 0/1. logistic regression. conjoint analysis. multi-level methods. Intro: multi-level analysis Logistic regression: finale (?).

E N D
Been there / done that: • Stata • Logistic regression (……) • Conjoint analysis Coming up: • Multi-level analyses Advanced MethodsandModels in Behavioral Research – 2014
AMMBR course design CONTENTMETHOD Y is 0/1 logistic regression conjoint analysis multi-level methods Advanced Methods and Models in Behavioral Research – 2014
Intro: multi-level analysis • Logistic regression: finale (?) Advanced MethodsandModels in Behavioral Research – 2014
MULTI – LEVEL ANALYSIS Advanced Methods and Models in Behavioral Research – 2014
In with the (multi-level) statistics... Y = student grade X = introversion Y = manager grade X = age Advanced Methods and Models in Behavioral Research – 2014
Multi-level models or ... • Bayesian hierarchical models • mixed models (in SPSS) • hierarchical linear models • random effects models • random coefficient models • subject specific models • variance component models • variance heterogeneity models dealing with clustered data. One solution: the variance component model Advanced Methods and Models in Behavioral Research – 2014
Clustered data -> multi-level models • Pupils within schools (within regions within countries) • Firms within regions (or sectors) • Vignettes within persons • Employees within stores (our fastfood.dta example) Advanced Methods and Models in Behavioral Research – 2014
Two issues with clustered data • Your estimates will (in all likelihood) be too precise: you find effects that do not exist in the population [make sureyou get that] • You will want to distinguish between effects within clusters and effects between clusters [see next two slides] Advanced Methods and Models in Behavioral Research – 2014
On individual vs aggregate data For instance: X = introversion X = age of McDonald’s employee Y = student grade(s) Y = like the manager Advanced Methods and Models in Behavioral Research – 2014
Had we only known, that the data are clustered! So the effect of an X within clusters can be different from the effect between clusters! Using the school example: lines represent schools. And within schools the effect of being introvert is positive! Advanced Methods and Models in Behavioral Research – 2014
MAIN MESSAGES Be able to recognize clustered data and deal with it appropriately (how to do that will follow) Distinguish two kinds of effects: those at the "micro-level" (within clusters) vs those at the aggregate level (between clusters). They need not be the same! (and ... do not test a micro-hypothesis with aggregate data) Advanced Methods and Models in Behavioral Research – 2014
Multi-level analysis:variance at different levels Advanced Methods and Models in Behavioral Research – 2014
3 2 exam score Overall mean(0) -1 -4 School 1 School 2 A toy example – two schools, two pupils Two schools each with two pupils. We first calculate the means. (taken from Rasbash) Overall mean= (3+2+(-1)+(-4))/4=0 Advanced Methods and Models in Behavioral Research – 2014
3 2 exam score Overall mean(0) -1 -4 School 1 School 2 Now the variance The total variance is the sum of the squares of the departures of the observations around the mean, divided by the sample size (4) = (9+4+1+16)/4=7.5 Advanced Methods and Models in Behavioral Research – 2014
3 2.5 2 exam score Overall mean(0) -1 -2.5 -4 School 1 School 2 The variance of the school means around the overall mean The variance of the school means around the overall mean= • (2.52+(-2.5)2)/2=6.25 (total variance was 7.5) Advanced Methods and Models in Behavioral Research – 2014
3 2.5 2 exam score -1 -2.5 -4 School 1 School 2 The variance of the pupils scores around their school’s mean The variance of the pupils scores around their school’s mean= ((3-2.5)2 + (2-2.5)2 + (-1-(-2.5))2 + (-4-(-2.5))2 )/4 =1.25 Advanced Methods and Models in Behavioral Research – 2014
-> So you can partition the total variance in individual level variance and school level variance How much of the variability in pupil attainment is attributable to factors at the school and how much to factors at the pupil level? In terms of our toy example we can now say 6.25/7.5= 82% of the total variation of pupils attainment is attributable to school level factors And this is important; we want to know how to explain (in this example) school attainment, and appararently the differences are at the school level more than the pupil level 1.25/7.5= 18% of the total variation of pupils attainment is attributable to pupil level factors Advanced Methods and Models in Behavioral Research – 2014
In a multi-level analysis, we would like to have an estimateof the amount of variance at theaggregate level vs at the individual level Advanced Methods and Models in Behavioral Research – 2014
Standard multiple regression won't do So you can use all the data and just run a multiple regression, but then you disregard the clustering effect, which gives uncorrect confidence intervalsandcannot distinguish between effects at the cluster vs at the school level Possible solution (but not so good) You can aggregate within clusters, and then run a multiple regression on the aggregate data. Two problems: no individual level testing possible + you get much less data points. So what can we do? Advanced Methods and Models in Behavioral Research – 2014
Multi-level models The standard multiple regression model assumes ... with the subscript "i" defined at the case-level. ... and the epsilons independently distributed with covariance matrix I. With clustered data, you know these assumptions are not met. Advanced Methods and Models in Behavioral Research – 2014
Solution 1: add dummy-variables per cluster • Try multiple regression, but with as many dummy variables as you have clusters (minus 1) ... where, in this example, there are j+1 clusters. IF the clustering differences are (largely) due to differences in the intercept between persons, this might work. BUT if there are only a handful of cases per person, this necessitates a huge number of extra variables Advanced Methods and Models in Behavioral Research – 2014
Solution 2: split your micro-level X-vars Say you have: then create: and add both as predictors (instead of x1) Make sure that you understand what is happening here, and why it is of use. Advanced Methods and Models in Behavioral Research – 2014
Solution 3: the variance component model In the variance component model, we split the randomness in a "personal part" and a "rest part" Advanced Methods and Models in Behavioral Research – 2014
NB solution 1 en 3 gaannietsamen Advanced Methods and Models in Behavioral Research – 2014
Now: how do you do this in Stata? <See Stata demo> [note to CS: use age and schooling as examples to split at restaurant level] relevant commands xtset and xtreg bys <varA>: egen <meanvarB> = mean(<varB>) gen dvarB = <varB> - <meanvarB> convenience commands tab <var>, gen() drop order des edit sum Advanced Methods and Models in Behavioral Research – 2014
Up next • How do we run the "Solution 1”, "Solution 2”, and “Solution 3” analysis and compare which works best? What about assumption checking? • Random intercept we now saw, but how about random slopes? Advanced Methods and Models in Behavioral Research – 2014
Non-response Advanced Methods and Models in Behavioral Research – 2014
Non-response analysis • Not all of the ones invited are going to participate • Think about selective non-response: some (kinds of) individuals might be less likely to participate. How might that influence the results? sample
Non-response scenarios: things to try • Compare sample with population on several characteristics … • … for instance by trying to ask questions to your whole sampling frame • Compare earlier response with later response Advanced MethodsandModels in Behavioral Research – 2014
What is still missing from these logit do files? Advanced MethodsandModels in Behavioral Research – 2014
What is still missing from these logit do files? • Try all the available tools: outliers, transformations, interactions, dummy-variables, analyze subsets, assumption checking … • Add more comments (in general) + add interpretation of the findings • In the end: conclude. A “final model” or … • … and that can also be a sequence of models Advanced MethodsandModels in Behavioral Research – 2014
Check out: My logistic regression run on auto.dta (Not easy to explain / thinking out loud / there is more than one correct answer) Advanced MethodsandModels in Behavioral Research – 2014
This Friday latest: • Deliver: per data file: one do-file • Make sure that it is complete. Questions / stuck? Ask! Advanced MethodsandModels in Behavioral Research – 2014