Download
1 / 32
320 likes | 432 Views
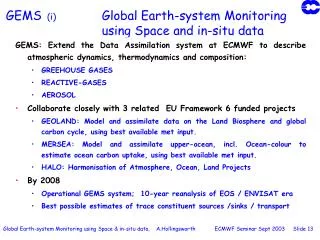
GEMS Global E arth-system M onitoring using S pace and in-situ data. GEMS– Overview. Atmospheric Composition and Dynamics Build an operational thoroughly-validated assimilation system for atmospheric composition and dynamics, by 2008. Daily global monitoring of dynamics & composition

E N D
GEMSGlobal Earth-system Monitoring using Space and in-situ data
GEMS– Overview • Atmospheric Composition and Dynamics • Build an operational thoroughly-validated assimilation system for atmospheric composition and dynamics, by 2008. • Daily global monitoring of dynamics & composition • Improvements in daily regional air quality forecasts • Monthly / seasonal estimates of surface fluxes for CO2 and other species • Extended reanalyses of composition & dynamics • Integrated Project co-funded by European Commission, 6th FP GMES (EC&ESA) Atmosphere theme • 31 consortium members • 4 years (started in March 2005)
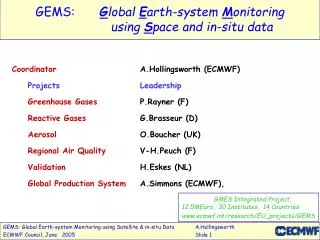
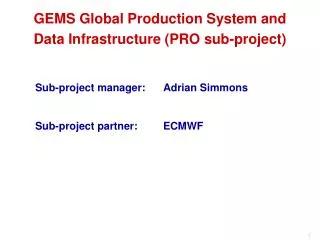
Goals of GEMS:Global Earth-system Monitoring using Space and in-situ data • Coordinator A.Hollingsworth (ECMWF) • Greenhouse Gases P.Rayner (LSCE) • Reactive Gases M.Schultz (Juelich) • Aerosols O.Boucher (MetOff) • Regional Air Quality V-H.Peuch (Meteo.Fr) • Validation H.Eskes (KNMI) • Production System A.Simmons (ECMWF)
Model inter-comparisons in GEMS • GHG: 2 modelsIFS (ECMWF), LMDzT (LSCE) • GRG: 3 models MOZART-3 (MPI-M), TM5 (KNMI), MOCAGE (MeteoFr) • AER: 1 modelIFS (-> AeroCom) • RAQ: 10 modelsMOCAGE (MeteoFr), BOLCHEM (CNR-ISAC), EURAD (FRIUUK), CHIMERE (CNRS), SILAM (FMI), MATCH (FMI), CAC (DMI), MM5-UAM-V (NKUA), EMEP (MetNo), REMO (MPI-M), UMAQ-UKCA (UKMO)
Same analysis applied to all models Communication platform A lot of work for analyzing team Progress of work guaranteed Large storage facilities needed Increased implication of individual groups Duplication of work Distribution by topic Progress depends on many people Large data transfer Analysis: Centralized vs Decentralized
Methodologies Subject of Comparison? • Fields / Fluxes / Processes Which method to use? • “Eyeball” methods • Basis statistical evaluation • Sophisticated skill scores What to compare? • Continuous behavior • Categorical behavior (Threshold exceedance) • Averaging in time & space Limited area / time verification
Topics to think about • Influence of model resolution • Interpolation techniques • Reference state (e.g. Observation, Climatology, Persistence, Median) • Errors of reference state / observations • Representativity of stations • Mixing of model skills • Maintenance of data base
Eyeball Methods Comparison of time series at a given location P. Agnew
(Educated) Eyeball Methods Comparison of fields at a given time (period) Plots taken from talk of Adrian Simmons at the GEMS Annual Assembly, Feb. 2006
Basis Statistic Evaluation HERBS (M. Chin) • How well does the distribution of model results corresponds to the distribution of observed quantities? • Histogram H • What is the average error of the model compared to the observations? • Mean error E • How well do the model calculated values correspond to the observed values? • Correlation CoefficientR • What is the model bias? • Mean bias B • What is the overall model skill? • Skill score S M. Chin
Basic statistical evaluation • (Rank) Correlation coefficient between observations and reference state • Slope and offset in scatter plots • (Normalized) Root-mean square errors • Bias (absolute and relative to reference values) • RMSE (absolute and relative to reference values) • Variability ratio (i.e. standard deviation of modelled values versus standard deviation of refecence values) • Contingency tables defined with respect to thresholds • Histograms of - absolute and relative - errors • … P. Agnew
Basic statistical evaluation (RAQ)(continous behaviour) • measure of overall forecast error fractional gross error • normalized RMSE not used: • errors not symmetric, • overweighting larger errors due to squaring P. Agnew
Basic statistical evaluation (RAQ)(continous behaviour) • extent of over/under prediction Modified mean bias: symmetric around 0, -1 -> 1, • degree of pattern match: Correlation Coefficient no offset P. Agnew
Taylor Diagramme • condense info of spatio-temporal varying fields • Use geometric relation between RMS – STDDEV – CORRELATION • Graphic display of model skill (RMS or others) correlation rms deviation standard deviation Reference M. Schulz
Taylor skill scores • Skill score should • increase monotonically with correlation • increase with match of modeled and observed variance • vary between 0-1 • S1 = 4(1+R) / [(f +1/ f)2(1+R0)] • S2 = 4(1+R)4 / [(f +1/ f)2(1+R0)4] (+penalty for low corr.) Where R0=max attainable R, f =std_dev (model)/std_dev (data)
obs O Yes O No mod F Yes Hits a False Alarms b a+b F No Misses c Correct Rejections d c+d a+c b+d a+b+c+d=n Categorical Skill Scores • Definition of an event or a threshold • Number of a certain event (‘hit’) • Basis: 2x2 contingency table P. Agnew
Radar Model forecast obs X > u X < u mod Y > u Hits a False Alarms b a+b Y < u Misses c Correct Rejections d c+d a+c b+d a+b+c+d=n Binary error image Radar > 1 mm Forecast > 1 mm Source: Marion Mittermaier, derived from Casati (2004) P. Agnew
Categorial Skill Scores: Odds Ratio (Stephensen, 2000) • ‘Odds Ratio’ defined as ratio of probability that event occurs to probability that event does not occur • Easily calculated from contingency table • Significance testing possible P. Agnew
How to compare ? M. Sofiev
Evaluation tools used/discussed within GEMS • MetPy (ECMWF) • MMAS (FMI) • AeroCom (LSCE) • several other tools at partner institutes • CDO, MetView?, CDAT, nco,…
MetPy • gridded data – gridded data (gridded data – station data) (station data – stat ion data) • Python-based scripts • user-friendly front end (“Verify”) • “all” formats which Python supports • to be run in batch mode • designed for operational use • additional visualization tool required C. Gibert et al., ECMWF
MetPy compute( param = Z, levtype = pl, levelist = (1000,500,100), score = (ancf,ref), steps = StepSequence(12,240,12), area = (‘europe’, ‘north hemisphere’), forecast = forecast ( ) persistence = persistence( ) analysis = analysis ( expver = ‘0001’, date = DateSequence(20040101,20040131), ) ) C. Gibert
Model and Measurement Analysis Software (MMAS) • Point data sets, NO MAPS station data – station data (ASCII) • easy menu-driven for individual use • to be run in Microsoft Windows environments • output: ASCII & GraDS bin • additional visualization tool needed M.Sofiev Finnish Meteorological Institute M. Sofiev
Input data sets Output data set Statistical characteristics ~ ~ ~ ~ ~ ~ ~ ~ ~ ~ ~ ~ ~ ~ ~ ~ Measurements Merged Model/Measurements Model Binary files with mapped statistics MMAS strategy • merges two arbitrary time-dependent data sets • computes statistics/skill scores for the merged sets • presents the results in numerical and graphic-ready format M. Sofiev
MANY THANKS TO Paul Agnew Olivier Boucher Mian Chin Fadoua Eddounia Hendrik Elbern Claude Gibert Kathy Law Dimitris Melas Martin Schultz Michael Schulz Mikhael Sofiev Leonor Tarrason
Odds Ratio Skill Score • A skill score can be derived by a simple transformation: ORSS=(OR-1)/(OR+1) • This mapping produces a skill score in the range -1 to +1 • When ORSS=-1 forecasts and observations are independent • Providing number of forecasts is statistically significant, ORSS approaching +1 indicates a skillful forecast
- different approaches around to do the data handling - software tools -regridding -visualisation -maximizing the use of 'ensemble' data versus individual models -involvement of participants. -dissemination of data -typical problems encountered during intercomparison and how to avoid them. - whatever you think is important to share with your collegues along this concept.
GEMS Research and Operational Goals Build an operational thoroughly-validated assimilation system for atmospheric composition and dynamics, by 2008. • Delivering • Daily global monitoring of dynamics & composition • Improvements in daily regional air quality forecasts • Monthly / seasonal estimates of surface fluxes for CO2 and other species • Extended reanalyses of composition & dynamics for validation, and in support of GCOS • Using • Best available models, assimilation systems • Best available in-situ data • Best available satellite data and algorithms • Collaboratingwith EU-IPs MERSEA & GEOLAND to implement IGOS_P Themes on • Carbon Cycle • Atmospheric Chemistry T. Hollingsworth T. Hollingsworth
GEMS– Overview • Atmospheric Composition and Dynamics • Build an operational thoroughly-validated assimilation system for atmospheric composition and dynamics, by 2008. • Integrated Project co-funded by European Commission, 6th FP GMES (EC&ESA) Atmosphere theme • 17 M€ budget, 12.5 M€ EC-contribution • 31 consortium members • 4 years (started in March 2005) T. Hollingsworth