Download
1 / 1
10 likes | 92 Views
Modelling the stellar sample from the Dark Energy Survey Bruno Rossetto 1 , Basílio Santiago 2 , Leo Girardi 3 , L.A.N. Da Costa 1 , M.A.G. Maia 1 , M. Makler 4 , P.S.S. Pellegrini 1 , B. Ramos 1. 1- MCT/Observatório Nacional, 2-Departamento de Astronomia, Instituto de Física, UFRGS

E N D
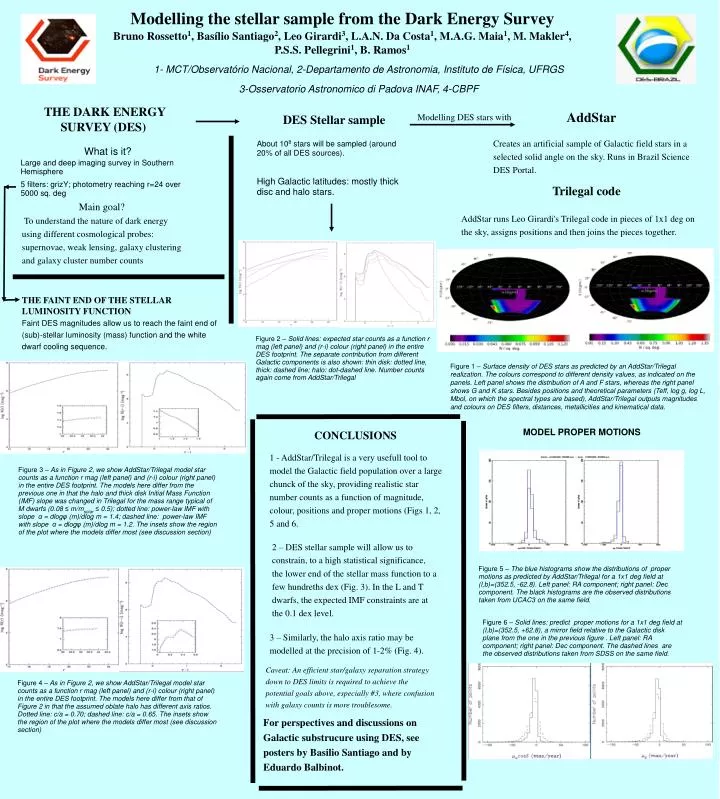
Modelling the stellar sample from the Dark Energy Survey Bruno Rossetto1, Basílio Santiago2, Leo Girardi3, L.A.N. Da Costa1, M.A.G. Maia1, M. Makler4, P.S.S. Pellegrini1, B. Ramos1 1- MCT/Observatório Nacional, 2-Departamento de Astronomia, Instituto de Física, UFRGS 3-Osservatorio Astronomico di Padova INAF, 4-CBPF THE DARK ENERGY SURVEY (DES) AddStar Modelling DES stars with DES Stellar sample Creates an artificial sample of Galactic field stars in a selected solid angle on the sky. Runs in Brazil Science DES Portal. About 108 stars will be sampled (around 20% of all DES sources). High Galactic latitudes: mostly thick disc and halo stars. What is it? Large and deep imaging survey in Southern Hemisphere 5 filters: grizY; photometry reaching r=24 over 5000 sq. deg Trilegal code Main goal? To understand the nature of dark energy using different cosmological probes: supernovae, weak lensing, galaxy clustering and galaxy cluster number counts AddStar runs Leo Girardi's Trilegal code in pieces of 1x1 deg on the sky, assigns positions and then joins the pieces together. THE FAINT END OF THE STELLAR LUMINOSITY FUNCTION Faint DES magnitudes allow us to reach the faint end of (sub)-stellar luminosity (mass) function and the white dwarf cooling sequence. Figure 2 – Solid lines: expected star counts as a function r mag (left panel) and (r-i) colour (right panel) in the entire DES footprint. The separate contribution from different Galactic components is also shown: thin disk: dotted line, thick: dashed line; halo: dot-dashed line. Number counts again come from AddStar/Trilegal Figure 1 – Surface density of DES stars as predicted by an AddStar/Trilegal realization. The colours correspond to different density values, as indicated on the panels. Left panel shows the distribution of A and F stars, whereas the right panel shows G and K stars. Besides positions and theoretical parameters (Teff, log g, log L, Mbol, on which the spectral types are based), AddStar/Trilegal outputs magnitudes and colours on DES filters, distances, metallicities and kinematical data. CONCLUSIONS MODEL PROPER MOTIONS 1 - AddStar/Trilegal is a very usefull tool to model the Galactic field population over a large chunck of the sky, providing realistic star number counts as a function of magnitude, colour, positions and proper motions (Figs 1, 2, 5 and 6. Figure 3 – As in Figure 2, we show AddStar/Trilegal model star counts as a function r mag (left panel) and (r-i) colour (right panel) in the entire DES footprint. The models here differ from the previous one in that the halo and thick disk Initial Mass Function (IMF) slope was changed in Trilegal for the mass range typical of M dwarfs (0.08 ≤ m/msolar≤ 0.5); dotted line: power-law IMF with slope α = dlogφ (m)/dlog m = 1.4; dashed line: power-law IMF with slope α = dlogφ (m)/dlog m = 1.2. The insets show the region of the plot where the models differ most (see discussion section) 2 – DES stellar sample will allow us to constrain, to a high statistical significance, the lower end of the stellar mass function to a few hundreths dex (Fig. 3). In the L and T dwarfs, the expected IMF constraints are at the 0.1 dex level. Figure 5 – The blue histograms show the distributions of proper motions as predicted by AddStar/Trilegal for a 1x1 deg field at (l,b)=(352.5, -62.8). Left panel: RA component; right panel: Dec component. The black histograms are the observed distributions taken from UCAC3 on the same field. Figure 6 – Solid lines: predict proper motions for a 1x1 deg field at (l,b)=(352.5, +62.8), a mirror field relative to the Galactic disk plane from the one in the previous figure . Left panel: RA component; right panel: Dec component. The dashed lines are the observed distributions taken from SDSS on the same field. 3 – Similarly, the halo axis ratio may be modelled at the precision of 1-2% (Fig. 4). Caveat: An efficient star/galaxy separation strategy down to DES limits is required to achieve the potential goals above, especially #3, where confusion with galaxy counts is more troublesome. Figure 4 – As in Figure 2, we show AddStar/Trilegal model star counts as a function r mag (left panel) and (r-i) colour (right panel) in the entire DES footprint. The models here differ from that of Figure 2 in that the assumed oblate halo has different axis ratios. Dotted line: c/a = 0.70; dashed line: c/a = 0.65. The insets show the region of the plot where the models differ most (see discussion section) For perspectives and discussions on Galactic substrucure using DES, see posters by Basilio Santiago and by Eduardo Balbinot.