Download
1 / 1
10 likes | 153 Views
Method. FFM (kg). Males (N = 40). R. MD (kg). Females (N =37). SEE (kg). Age (yr). HW (M). 52.9 ± 11.7. 14.9 ± 1.7. 15.5 ± 1.9. BIA (M). Height (m). 53.0 ± 9.4. 1.72 ± 0.09. 0.96. 0.13 ± 3.9. 1.61 ± 0.06. 3.28. HW (F). Body mass (kg). 43.5 ± 4.7. 62.4 ± 13.0.

E N D
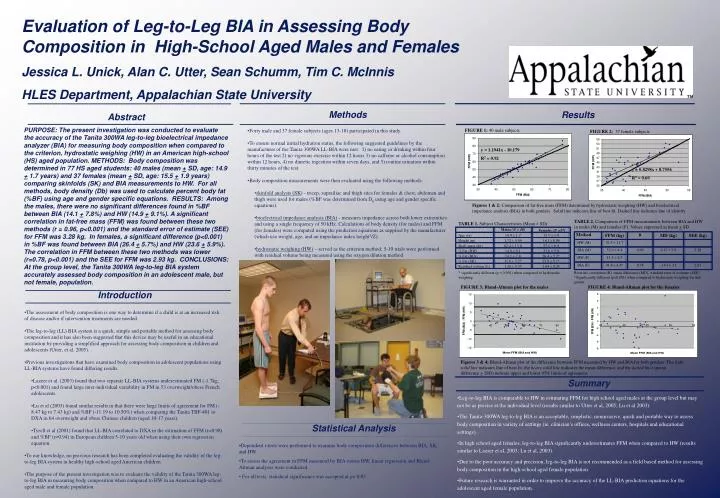
Method FFM (kg) Males (N = 40) R MD (kg) Females (N =37) SEE (kg) Age (yr) HW (M) 52.9 ± 11.7 14.9 ± 1.7 15.5 ± 1.9 BIA (M) Height (m) 53.0 ± 9.4 1.72 ± 0.09 0.96 0.13 ± 3.9 1.61 ± 0.06 3.28 HW (F) Body mass (kg) 43.5 ± 4.7 62.4 ± 13.0 57.1 ± 6.9 BIA (F) % Fat (HW) 41.8 ± 4.4* 14.9 ± 9.1 0.78 -1.63 ± 3.1 23.6 ± 5.9 2.93 % Fat (BIA) 14.1 ± 7.8 26.4 ± 5.7* % Fat (SK) 11.8 ± 7.2* 27.9 ± 5.1* Residual volume (L) 1.26 ± 0.35 1.04 ± 0.25 Evaluation of Leg-to-Leg BIA in Assessing Body Composition in High-School Aged Males and Females Jessica L. Unick, Alan C. Utter, Sean Schumm, Tim C. McInnis HLES Department, Appalachian State University • Methods • Forty male and 37 female subjects (ages 13-18) participated in this study. • To ensure normal initial hydration status, the following suggested guidelines by the manufacturer of the Tanita 300WA LL-BIA were met: 1) no eating or drinking within four hours of the test 2) no vigorous exercise within 12 hours 3) no caffeine or alcohol consumption within 12 hours, 4) no diuretic ingestion within seven days, and 5) routine urination within thirty minutes of the test. • Body composition measurements were then evaluated using the following methods: • skinfold analysis (SK) - tricep, suprailiac and thigh sites for females & chest, abdomen and thigh were used for males (%BF was determined from Db using age and gender specific equations). • bioelectrical impedance analysis (BIA) - measures impedance across both lower extremities and using a single frequency of 50 kHz. Calculations of body density (for males) and FFM (for females) were computed using the prediction equations as supplied by the manufacturer (which use weight, age, and an impedance index height2/Z). • hydrostatic weighing (HW) – served as the criterion method; 5-10 trials were performed with residual volume being measured using the oxygen dilution method Results Abstract PURPOSE: The present investigation was conducted to evaluate the accuracy of the Tanita 300WA leg-to-leg bioelectrical impedance analyzer (BIA) for measuring body composition when compared to the criterion, hydrostatic weighing (HW) in an American high-school (HS) aged population. METHODS: Body composition was determined in 77 HS aged students: 40 males (mean + SD, age: 14.9 + 1.7 years) and 37 females (mean + SD, age: 15.5 + 1.9 years) comparing skinfolds (SK) and BIA measurements to HW. For all methods, body density (Db) was used to calculate percent body fat (%BF) using age and gender specific equations. RESULTS: Among the males, there were no significant differences found in %BF between BIA (14.1 + 7.8%) and HW (14.9 + 9.1%). A significant correlation in fat-free mass (FFM) was found between these two methods (r = 0.96, p<0.001) and the standard error of estimate (SEE) for FFM was 3.28 kg. In females, a significant difference (p<0.001) in %BF was found between BIA (26.4 + 5.7%) and HW (23.6 + 5.9%). The correlation in FFM between these two methods was lower (r=0.78, p<0.001) and the SEE for FFM was 2.93 kg. CONCLUSIONS: At the group level, the Tanita 300WA leg-to-leg BIA system accurately assessed body composition in an adolescent male, but not female, population. FIGURE 1: 40 male subjects FIGURE 2: 37 female subjects y = 1.1941x - 10.179 R2 = 0.92 y = 0.8298x + 8.7556 R2 = 0.60 Figures 1 & 2: Comparison of fat-free mass (FFM) determined by hydrostatic weighing (HW) and bioelectrical impedance analysis (BIA) in both genders. Solid line indicates line of best fit. Dashed line indicates line of identity TABLE 2. Comparison of FFM measurements between BIA and HW in males (M) and females (F). Values expressed as mean + SD TABLE 1. Subject Characteristics (Mean ± SD) * significantly different (p < 0.001) when compared to hydrostatic weighing Bivariate correlation (R), mean difference (MD), standard error of estimate (SEE) *Significantly different (p<0.001) when compared to hydrostatic weighing for that gender • Introduction • The assessment of body composition is one way to determine if a child is at an increased risk of disease and/or if intervention treatments are needed. • The leg-to-leg (LL) BIA system is a quick, simple and portable method for assessing body composition and it has also been suggested that this device may be useful in an educational institution by providing a simplified approach for assessing body composition in children and adolescents (Utter, et al. 2005). • Previous investigations that have examined body composition in adolescent populations using LL-BIA systems have found differing results. • Lazzer et al. (2003) found that two separate LL-BIA systems underestimated FM (-1.7kg, p<0.001) and found large inter-individual variability in FM in 53 overweight/obese French adolescents. • Lu et al (2003) found similar results in that there were large limits of agreement for FM (-8.47 kg to 7.43 kg) and %BF (-11.19 to 10.50%) when comparing the Tanita TBF-401 to DXA in 64 overweight and obese Chinese children (aged 10-17 years). • Tyrell et al (2001) found that LL-BIA correlated to DXA in the estimation of FFM (r=0.98) and %BF (r=0.94) in European children 5-10 years old when using their own regression equation. • To our knowledge, no previous research has been completed evaluating the validity of the leg-to-leg BIA system in healthy high-school aged American children. • The purpose of the present investigation was to evaluate the validity of the Tanita 300WA leg-to-leg BIA in measuring body composition when compared to HW in an American high-school aged male and female population. FIGURE 3: Bland-Altman plot for the males FIGURE 4: Bland-Altman plot for the females Figures 3 & 4: Bland-Altman plot of the difference between FFM measured by HW and BIA for both genders. The light solid line indicates line of best fit, the heavy solid line indicates the mean difference, and the dotted lines (mean difference + 2SD) indicate upper and lower 95% limits of agreement. Summary • Leg-to-leg BIA is comparable to HW in estimating FFM for high school aged males at the group level but may not be as precise at the individual level (results similar to Utter et al, 2005; Lu et al 2003). • The Tanita-300WA leg-to-leg BIA is an acceptable, simplistic, noninvasive, quick and portable way to assess body composition in variety of settings (ie. clinician’s offices, wellness centers, hospitals and educational settings). • In high school aged females, leg-to-leg BIA significantly underestimates FFM when compared to HW (results similar to Lazzer et al, 2003; Lu et al, 2003). • Due to the poor accuracy and precision, leg-to-leg BIA is not recommended as a field based method for assessing body composition in the high-school aged female population. • Future research is warranted in order to improve the accuracy of the LL-BIA prediction equations for the adolescent aged female population. Statistical Analysis • Dependent t-tests were performed to examine body composition differences between BIA, SK, and HW • To assess the agreement in FFM measured by BIA versus HW, linear regression and Bland-Altman analyses were conducted • For all tests, statistical significance was accepted at p< 0.05.