Download
1 / 25
250 likes | 385 Views
Estimating the proportion of hatchery-origin spawners using parentage-based tagging. by Richard Hinrichsen , Shawn Narum , Matt Campbell, Mike Ackerman, Craig Steele, Maureen Hess, Bill Young, Barbara Shields, Brian Maschhoff. Funded by: Bonneville Power Administration.

E N D
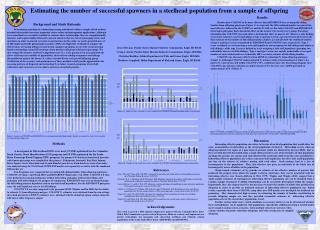
Estimating the proportion of hatchery-origin spawners using parentage-based tagging by Richard Hinrichsen, Shawn Narum, Matt Campbell, Mike Ackerman, Craig Steele, Maureen Hess, Bill Young, Barbara Shields, Brian Maschhoff Funded by: Bonneville Power Administration www.onefishtwofish.net
Why Estimate Hatchery-Origin Spawners? • These fish originate in hatchery, are released as juveniles, and return to spawn in the wild. • Influx of hatchery spawnersaffects population dynamics by artificially increasing spawnernumbers. • Influences: density dependence, reproductive success. • Genetic effects (Christie et al. 2012). • Mark R. Christie, Melanie L. Marine, Rod A. French, and Michael S. Blouin. 2012. Genetic adaptation to captivity can occur in a single generation. PNAS 109:238-242. www.onefishtwofish.net
Relative Reproductive Success of Hatchery-born Spawners • Chilcote et al. (2011) found that a naturally spawning population composed entirely of hatchery-origin spawners would have a reproductive performance that is 0.128 of that expected for a population composed entirely of wild-origin spawners. • The study was based on 93 salmon populations in Oregon, Washington, and Idaho, that were known to contain both wild and hatchery fish. Three species were represented: steelhead, cohoand chinook. www.onefishtwofish.net
Source: Chilcote et al. (2011) CJFAS www.onefishtwofish.net
Using CWT To Estimate Ph • A fraction of juvenile fish at source hatcheries are visibly marked with a fin clip (adipose or other) or implant elastomer tag. • Furthermore, some juvenile fish are tagged with a coded-wire tag that identifies the hatchery of origin. • Spawning fish are sampled using carcass surveys. www.onefishtwofish.net
Visible Marks (VM) • Visible Implant Elastomer tags (VIE) • Adipose Fin Clip www.onefishtwofish.net
Coded Wire Tags (CWT) Source: Northwest Marine Technology. Magnified section of a CWT (1.1 mm long) before insertion into the snout of a juvenile salmon. www.onefishtwofish.net
Carcass Survey • Fish with CWT are indentified with a hand-held wand device; snouts sawed off to recover tags. www.onefishtwofish.net
An Easy Solution • Use constant VM fraction at all source hatcheries! For example, l = 0.25. In that case, is an estimate of the total number of hatchery-origin spawners on the spawning grounds. www.onefishtwofish.net
HANFORD REACH EXAMPLE Priest Rapids H Lyons Ferry H Ringold Springs H Little White Salmon NFH Umatilla H Source: Hinrichsen, Sharma & Fisher (2012) TAFS:
Total Numbers Released www.onefishtwofish.net
VM or CWTIn 2010 Hanford Reach Carcass Survey www.onefishtwofish.net
Simplified Method of Moments Estimator • x1,i is the number of carcasses sampled that were VM and CWT at hatchery i. • qi is the sample rate • li is the VM fraction at source hatchery i. • fi is the CWT fraction at source hatchery i
Method of Moments For both VM&CWT and VM only • VM&CWT equations • VM only equation www.onefishtwofish.net
Proportions of Hatchery-Origin Spawners (Hatchery-specific) • GLSE • var(GLSE) var(SMME) www.onefishtwofish.net
Proportion of Total Hatchery-Origin Spawners • GLSE • var(GLSE) var(SMME) www.onefishtwofish.net
CV of the GLSE and SMME relative to tagged fraction, f. Number of hatcheries = 2; True spawning population = 1000; true value of p = 0.5; sample rate = 0.20; H1 = H2; VM fraction of one hatchery is 1.0, and the other is 0.5. www.onefishtwofish.net
Ambiguity in hatchery of origin Hatchery #3 Hatchery #1 Hatchery #2 S p a w n i n g G r o u n d s CWT CWT CWT SAMPLE www.onefishtwofish.net
Parentage-Based Tagging • Parentage-based tagging (PBT) instead of CWT • Single Nucleotide Polymorphisms (SNPs) used to determine parents and therefore, hatchery of origin and brood year. • Increased tagging fractions can solve problem of ambiguity in determining hatchery of origin. www.onefishtwofish.net
Parentage-Based Tagging (PBT) • Genotype hatchery broodstock with SNPs and record genotypes in a data base of parents. • Sample carcasses on spawning grounds. • Determine if carcass genotype comes from parents in data base (is tagged) (Anderson 2010). • Use tag to determine release group. • Anderson, E.C. 2010. Computational algorithms and user-friendly software for parentage-based tagging of Pacific salmonids. SWFSC Final Report 10 March 2010. www.onefishtwofish.net
Tag Loss • Data from the South Fork Salmon show that 29 of 218 samples failed to genotype. • Culprit: carcass decay. • PBT tagging fraction for the McCall spawn year 2008 and spawn year 2009 broodstockwere 97.61% and 96.43%, respectively. • The tagging rate is estimated for each hatchery by squaring the proportion of successfully genotyped broodstock. • Accounting for tag loss, the effective tagging fraction was approximately 0.97 x (218-29)/218 = 0.84. www.onefishtwofish.net
Sensitivity Analysis VM 25% all releases VM 100% all releases www.onefishtwofish.net
Please Visit Us! www.onefishtwofish.net
Conclusions • When marking fractions at all source hatcheries are equal, estimation is simple. However, when marking fractions vary widely, estimation is complex and precision may decrease. • Small tagging fractions can lead to ambiguity in estimation of proportion of hatchery-origin spawners and loss of precision; • In the Hanford Reach example, very few (23) carcasses tested positive for a CWT. • PBT has the potential to increase numbers of tagged carcasses and thereby increase precision of estimates of the proportion of hatchery-origin spawners. www.onefishtwofish.net