Download
1 / 1
10 likes | 94 Views
Computational modeling of Clostridium acetobutylicum Jonathan Smeton Mentored by Dr. Margaret Hurley. Extracellular Gal. Gal6P. Gal1P. Ga l. T6P. GlP. F6P. T16BP. F16BP. DHAP. G3P. BPG. 3PG. Introduction. 2PG. PEP. Materials and Methods (cont.). Conclusion. Pyr.

E N D
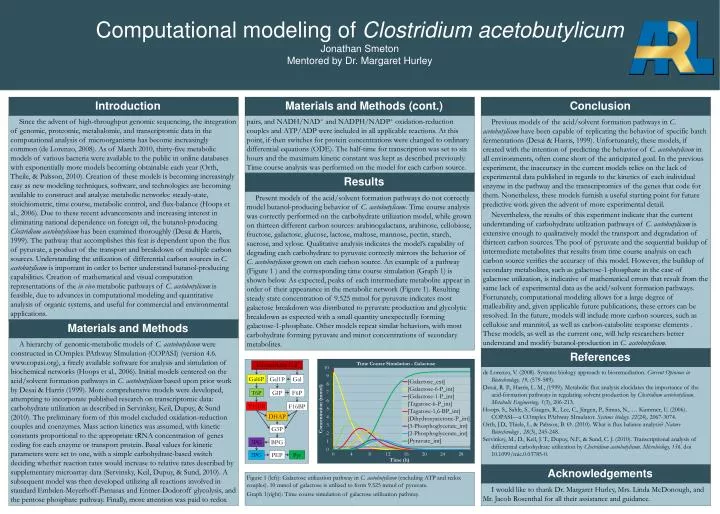
Computational modeling of Clostridium acetobutylicumJonathan SmetonMentored by Dr. Margaret Hurley Extracellular Gal Gal6P Gal1P Gal T6P GlP F6P T16BP F16BP DHAP G3P BPG 3PG Introduction 2PG PEP Materials and Methods (cont.) Conclusion Pyr Since the advent of high-throughput genomic sequencing, the integration of genomic, proteomic, metabalomic, and transcriptomic data in the computational analysis of microorganisms has become increasingly common (de Lorenzo, 2008). As of March 2010, thirty-five metabolic models of various bacteria were available to the public in online databases with exponentially more models becoming obtainable each year (Orth, Theile, & Palsson, 2010). Creation of these models is becoming increasingly easy as new modeling techniques, software, and technologies are becoming available to construct and analyze metabolic networks: steady-state, stoichiometric, time course, metabolic control, and flux-balance (Hoops et al., 2006). Due to these recent advancements and increasing interest in eliminating national dependence on foreign oil, the butanol-producing Clostridium acetobutylicum has been examined thoroughly (Desai & Harris, 1999). The pathway that accomplishes this feat is dependent upon the flux of pyruvate, a product of the transport and breakdown of multiple carbon sources. Understanding the utilization of differential carbon sources in C. acetobutylicum is important in order to better understand butanol-producing capabilities. Creation of mathematical and visual computation representations of the in vivo metabolic pathways of C. acetobutylicum is feasible, due to advances in computational modeling and quantitative analysis of organic systems, and useful for commercial and environmental applications. pairs, and NADH/NAD+ and NADPH/NADP+ oxidation-reduction couples and ATP/ADP were included in all applicable reactions. At this point, if-then switches for protein concentrations were changed to ordinary differential equations (ODE). The half-time for transcription was set to six hours and the maximum kinetic constant was kept as described previously. Time course analysis was performed on the model for each carbon source. Previous models of the acid/solvent formation pathways in C. acetobutylicum have been capable of replicating the behavior of specific batch fermentations (Desai & Harris, 1999). Unfortunately, these models, if created with the intention of predicting the behavior of C. acetobutylicum in all environments, often come short of the anticipated goal. In the previous experiment, the inaccuracy in the current models relies on the lack of experimental data published in regards to the kinetics of each individual enzyme in the pathway and the transcriptomics of the genes that code for them. Nonetheless, these models furnish a useful starting point for future predictive work given the advent of more experimental detail. Nevertheless, the results of this experiment indicate that the current understanding of carbohydrate utilization pathways of C. acetobutylicum is extensive enough to qualitatively model the transport and degradation of thirteen carbon sources. The pool of pyruvate and the sequential buildup of intermediate metabolites that results from time course analysis on each carbon source verifies the accuracy of this model. However, the buildup of secondary metabolites, such as galactose-1-phosphate in the case of galactose utilization, is indicative of mathematical errors that result from the same lack of experimental data as the acid/solvent formation pathways. Fortunately, computational modeling allows for a large degree of malleability and, given applicable future publications, these errors can be resolved. In the future, models will include more carbon sources, such as cellulose and mannitol, as well as carbon-catabolite response elements . These models, as well as the current one, will help researchers better understand and modify butanol-production in C. acetobutylicum. Results Present models of the acid/solvent formation pathways do not correctly model butanol-producing behavior of C. acetobutylicum. Time course analysis was correctly performed on the carbohydrate utilization model, while grown on thirteen different carbon sources: arabinogalactans, arabinose, cellobiose, fructose, galactose, glucose, lactose, maltose, mannose, pectin, starch, sucrose, and xylose. Qualitative analysis indicates the model’s capability of degrading each carbohydrate to pyruvate correctly mirrors the behavior of C. acetobutylicum grown on each carbon source. An example of a pathway (Figure 1 ) and the corresponding time course simulation (Graph 1) is shown below. As expected, peaks of each intermediate metabolite appear in order of their appearance in the metabolic network (Figure 1). Resulting steady state concentration of 9.525 mmol for pyruvate indicates most galactose breakdown was distributed to pyruvate production and glycolytic breakdown as expected with a small quantity unexpectedly forming galactose-1-phosphate. Other models repeat similar behaviors, with most carbohydrate forming pyruvate and minor concentrations of secondary metabolites. Materials and Methods A hierarchy of genomic-metabolic models of C. acetobutylicum were constructed in COmplexPAthwaySImulation (COPASI) (version 4.6. www.copasi.org), a freely available software for analysis and simulation of biochemical networks (Hoops et al., 2006). Initial models centered on the acid/solvent formation pathways in C. acetobutylicum based upon prior work by Desai & Harris (1999). More comprehensive models were developed, attempting to incorporate published research on transcriptomic data: carbohydrate utilization as described in Servinksy, Keil, Dupuy, & Sund (2010). The preliminary form of this model excluded oxidation-reduction couples and coenzymes. Mass action kinetics was assumed, with kinetic constants proportional to the appropriate tRNA concentration of genes coding for each enzyme or transport protein. Basal values for kinetic parameters were set to one, with a simple carbohydrate-based switch deciding whether reaction rates would increase to relative rates described by supplementary microarray data (Servinsky, Keil, Dupuy, & Sund, 2010). A subsequent model was then developed utilizing all reactions involved in standard Embden-Meyerhoff-Parnasas and Entner-Dodoroffglycolysis, and the pentose phosphate pathway. Finally, more attention was paid to redox References de Lorenzo, V. (2008). Systems biology approach to bioremediation. Current Opinions in Biotechnology, 19, (579-589). Desai, R. P., Harris, L. M., (1999). Metabolic flux analysis elucidates the importance of the acid-formation pathways in regulating solvent production by Clostridium acetobutylicum. Metabolic Engineering, 1(3), 206-213. Hoops. S., Sahle, S., Gauges, R., Lee, C., Jürgen, P., Simus, N., … Kummer, U. (2006). COPASI—a COmplexPAthwaySImulator. Systems biology. 22(24), 2067-3074. Orth, J.D., Thiele, I., & Palsson, B. Ø. (2010). What is flux balance analysis? Nature Biotechnology , 28(3), 245-248. Servinksy, M., D., Keil, J. T., Dupuy, N.F., & Sund, C. J. (2010). Transcriptional analysis of differential carbohydrate utilization by Clostridium acetobutylicum. Microbiology, 156. doi 10.1099/mic.0.03785-0. Acknowledgements Figure 1 (left): Galactose utilization pathway in C. acetobutylicum (excluding ATP and redox couples). 10 mmol of galactose is utilized to form 9.525 mmol of pyruvate. Graph 1(right): Time course simulation of galactose utilization pathway. I would like to thank Dr. Margaret Hurley, Mrs. Linda McDonough, and Mr. Jacob Rosenthal for all their assistance and guidance.