Download
1 / 39
400 likes | 591 Views
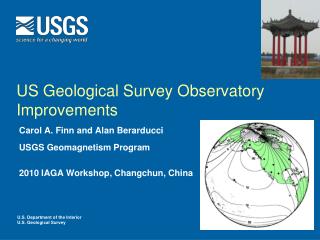
Lecture #10: Geoelectrical Studies of Lithospheric Structure. IPRCC and SinoProbe Short Course: Lithospheric Evolution through Time April 8-12, 2011. Walter D. Mooney, Ph.D. US Geological Survey Menlo Park, California USA mooney@usgs.gov.

E N D
Lecture #10: Geoelectrical Studies of Lithospheric Structure IPRCC and SinoProbe Short Course: Lithospheric Evolution through Time April 8-12, 2011 Walter D. Mooney, Ph.D. US Geological Survey Menlo Park, California USA mooney@usgs.gov
Acknowledgement:Geoelectric studies of the lithosphere This lecture is by Prof. Alan G. Jones Dublin Institute for Advanced Studies Lecture presented as part of the Short Course: Integrated Studies of Lithospheric Evolution: A Global Perspective by Dr. Walter Mooney (USGS), 22-26 November, 2010
Electro-magnetic (EM) methods (1)... • give information about... • structures • presence of fluids and/or conducting metasediments • dimensionality (2D or 3D) • strike direction and its depth dependence
EM methods (2)... • sense a physical parameter (electrical conductivity) that varies by over EIGHT orders of magnitude • sense its lateral and vertical variations • with natural sources, penetration to all depths is assured (but with decreasing resolution)
Skin Depth…. Penetration to all depths is assured with MT - just need to record sufficiently long periods
Parameter measured:electrical conductivity (1/resistivity)Range...
Conduction mechanisms in the mantle • ionic conduction due to movement of mobile charged ions • 1) partial melt • 2) H+ • electronic conduction due to movement of electrons • 3) hydrous mineral phase (e.g. phlogopite) • 4) carbon on grain boundary films
Partial melt… Partial melt connects efficiently and increases electrical conductivity by orders of Magnitude H20-saline mix
Why MT? Sensitivity to partial melt Resistivity decreases by orders of magnitude at onset of partial melt High sensitivity to e.g. base of lithosphere (LAB) Partial melt of silicate rocks (dry pyroxene granulite) Partzsch et al. (2000)
Why use electromagnetism? Image the base of the sub-continental lithospheric mantle Diamonds only exist in thick cold cratonic roots Kimberlites passing through such roots bring diamonds up
Electrical comparedwith Seismic asthenosphere Excellent spatial correlation between presence of upper mantle low velocity zone and region of high conductivity (Alekseyev et al. 1977)
Slave craton: EM studies • 1996: Profile 1 MT survey • 1998,99 & 2000: Winter road surveys • 1998/99 & 99/2000: Slave lakes • 2000: TGI survey
Depth to Moho Source: Mooney et al., 1998
Archean Proterozoic Phanerozoic 3Ga 2Ga 1Ga 0Ga Tectonic Ages
SNORCLE: Rae - Tibbit Flat reflection Moho beneath Anton complex at ~12 s TWTT (~36 km)Refraction Moho at 35-36 kmTeleseismic Moho at ~36 km Rae YK Tibbit
Slave craton:Rae-YK-Tibbitprofile Rae Yellowknife Site 106 Tibbit Lake
Slave location map 1996 sites (dots) 1998-2000 winter road sites (squares) Lake sites (stars) TGI sites (triangles) Significant kimberlite pipes (yellow diamonds) Going to show responses from two sites (red circles)
2-D resistivity model of Slave craton:conductor at shallow depths (80 - 120 km) in SCLM spatially correlated with Lac de Gras (LdG) kimberlite field
2-D resistivity model of Slave craton:conductor at shallow depths (80 - 120 km) in SCLM spatially correlated with Lac de Gras (LdG) kimberlite field
Interpretation in terms of carbon We know that the region is anomalous in its carbon content in the mantle. Is there carbon in graphite form concentrated at 80-100 km depth beneath Lac de Gras?
SASE/KSA Southern African (or Kaapvaal) Seismic Experiment 2 year deployment at central (dark blue) stations 1 year only at other stations
Natural laboratory: Southern Africa Tectonic map from Dr. Sue Webb (Wits) Based on exposed geology in South Africa and Zimbabwe, but based on magnetic map in Namibia and Botswana where there is thick cover
SAMTEX cf. SASE coverage Four phases of SAMTEX covers South Africa and southern Botswana as SASE, but also covers northern Botswana and Namibia (terra incognita)
1-D responses Resistivity is independent of rotation angle a one-dimensional layered Earth is a valid model
2-D model: Main result – variation in LAB S N 100 ? 200 300 Lithospheric thickness varies along the profile, with the thickest part from just south of Kimberley -> north of Pretoria
Fishwick’s 2009 regional models 2-stage surface wave inversion method 1) fundamental + first four higher models: period range 50-120 seconds 2) 1.5 degree splines Includes data from GFZ stations in NW Namibia 2009: 8200 paths
New velocity model VsF1.5d at 100 km Low velocity “notch” in southern extension of Angola Craton
Comparison of velocity model and resistivity image SAMTEX Fishwick
Three views of the cratonic lithosphere:1. Seismic2. Thermal3. Electrical
Thermal Lithosphere Thickness (Depth to 1300 °C) Source: Artemieva and Mooney, 2000