Download
1 / 30
300 likes | 531 Views
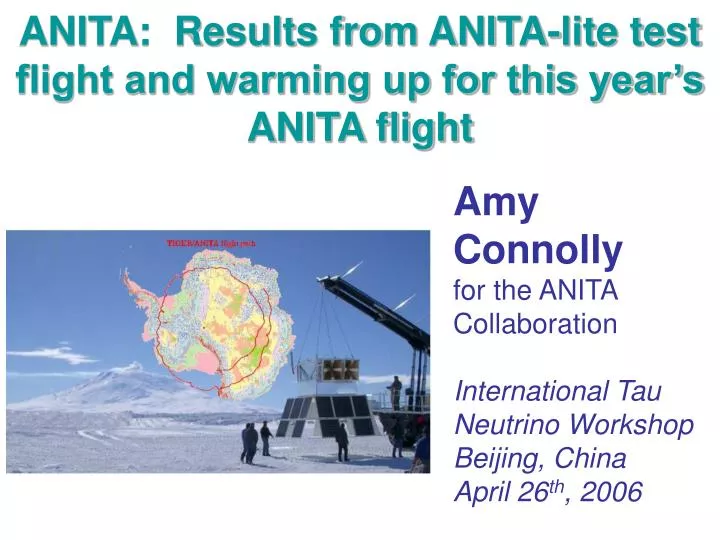
ANITA: Results from ANITA-lite test flight and warming up for this year’s ANITA flight. Amy Connolly for the ANITA Collaboration International Tau Neutrino Workshop Beijing, China April 26 th , 2006. ANITA (ANtarctic Impulsive Transient Antenna). Each flight ~15 days – or more.

E N D
ANITA: Results from ANITA-lite test flight and warming up for this year’s ANITA flight Amy Connolly for the ANITA Collaboration International Tau Neutrino Workshop Beijing, China April 26th, 2006
ANITA (ANtarctic Impulsive Transient Antenna) Each flight ~15 days – or more 32 quad-ridged horn antennas, dual-polarization, with 10± cant Downgoing - not seen by payload Upcoming – absorbed in the earth ! ANITA sees “skimmers”.
The ANITA Collaboration University of California at Irvine Irvine, California Ohio State University Columbus, Ohio University of Kansas Lawrence, Kansas Washington University in St. Louis St. Louis, Kansas University of Minnesota Minneapolis, Minnesota University of Delaware Newark, Delaware University of California at Los Angeles Los Angeles, California Pennsylvania State University University Park, Pennsylvania University of Hawaii at Manoa Honolulu, Hawaii Jet Propulsion Laboratory Pasadena, California
ANITA-lite 2003-2004 • Practice run with 2 antennas – piggybacked on TIGER • 18 day flight • Virtually every subsystem planned for ANITA tested • Calibration pulses sent to payload from ~200 km away • Payload landed near Mawson Station • Australians have helped us retrieve the payload
Anita-lite (cont) • Flying two antennas with angular separation 22° allowed us the measure ANITA’s angular resolution • Compare time of arrival of calibration pulses =0.16 ns Angular resolution measured: ANITA-lite: ( t)=0.16 ns !()=2.3± Full ANITA: expect (t)=0.1 ns → ()=1.5°, ()=0.5° t (ns) • Could verify that a signal comes from the ice • Help discern near, far events ! for energy measurement, for example Remember that this is resolution on RF direction
ANITA Signal Acquisition • Trigger: Signal divided into frequency sub bands • Powerful rejection against narrow bandwidth backgrounds • Multi-band coincidence allows better noise rejection • 8 channels/ antenna • Require 3/8 channels fire for antenna to pass L1 trigger • Global trigger analyzes information across antennas • For Anita-lite, no banding: 4 channels, require 3-fold coincidence
Anita-lite • Two independent analyses modeled time dependent pulse on measured noise • Designed cuts to select Askaryan-like events • # cycles in a waveform • Integrated power • Time coincidence between channels • Reduce noise with cross-correlation analysis • Both analyses find analysis efficiency ~50% • ANITA-lite strongly constrains Z-burst models ES&S baseline (min) Kalashev, et al., saturate all bounds (max)
n ice ANITA Simulation • Two major simulation efforts: Hawaii (Gorham) and UCLA (Connolly) • Signal in frequency domain, but moving to time domain • Secondary interactions included • Ray tracing through ice, firn (packed snow near surface) • Attenuation lengths are depth and frequency dependent • Fresnel coefficients • Include surface slope and adding surface roughness • All 32 quad ridged horn antennas arranged in 3 layers as they are on the payload • Measured antenna response • Models 3-level trigger system • Weighting accounts for neutrino attenuation through Earth Complementary simulations being developed – essential! [S. Barwick]
Characterizing ANITA’s Sensitivity Position of Interactions 1020 eV Depth of Interactions 1018.5 eV 1020 eV Angle wrt Surface Neutrino Flavor 1020 eV meters 1018.5 eV downgoing 1018.5 eV 1020 eV (°) m t e
Possibility of Seeing Multi-Pulse Events • Could see multi-pulse events from interaction and subsequent • Decay • Photonuclear interaction • Brem, pair production • However, some may escape the earth before second interaction E=1018.5 E=1020.0 Sensitivity to “multi bangs” is under investigation
Cross Section • ANITA not nominally sensitive to n-N cross section since • Measure RF direction, not n direction • Unless we are lucky, do not expect a large sample of events for a shape analysis • However, one recent idea may give us a handle on the n-N cross section…
n TIR Reflected RaysWork by: S. Barwick, F. Wu from University of California at Irvine • ANITA could (possibly) detect events where a signal is reflected from ice-bedrock interface • At large cross-sections, short pathlengths → down-going neutrinos dominate ! reflected rays important [S. Barwick & F. Wu] Direct rays Events Micro-black holes at ANITA Energies [S. Barwick] Reflected rays • Signals suffer from extra attenuation through ice and losses at reflection • At SM ’s, reflected rays not significant 1 100 10 1000 /SM • Could measure cross section from relative rates of direct (far) to reflected (near).
Skymaps For each balloon position: After a complete trip around the continent, cover all Right Ascensions If we could observe reflected rays, could view more sky! 10% reflected power Uncertainty at ice-bedrock interface being investigated: under-ice topologies, radar reflectivities, use Brealt code to study interfaces quantitatively
ANITA Engineering Flight, August 2005 • August 29,2005, Ft. Sumner New Mexico • All subsystems represented (two dual-pol. antennas only, to limit landing damage) • 8 m tall Gondola performed perfectly • No science possible due to EMI (Cannon AFB in nearby Clovis), but waveform recording worked well • Full ANITA payload now cleared for Antarctica Average power Azimuth to Clovis, deg.
Stanford Linear Accelerator Calibration • ANITA is going to SLAC for 2 weeks of beam time in End Station A during June 2006 • Full-up system calibration with actual Askaryan impulses from Ice • Uses one of SLAC’s largest experiment halls (End Station A) 250’x200’ w/ 50’ crane • Build 1.6 x 1.6 x 5 m ice cube by stacking blocks, “zamboni” each surface before stacking, refrigerate • Will provide amplitude, phase, polarization, temporal, and spectral calibration of the antenna array, including all structure • Excellent opportunity to calibrate the simulation • Payload will be shipped to Antarctica from California after the SLAC test
Summary • Anita-lite test flight a success, ruled out Z-burst models • Simulations are mature, constantly improving • Valuable tool for testing ideas, assessing sensitivity • Engineering flight showed full system working perfectly • Full system calibration of the system in June • First physics flight at the end of this year • Ready for some neutrinos Thank you to the organizers of the conference!
Keys to Improving Sensitivity • Since ANITA is near the threshold of GZK neutrino detection • Necessary to reduce systematics as much as possible • Make the most of our data set • Requires detailed simulation of • Noise, Signal, and Trigger response in the time domain • Simulating noise may prevent having to sacrifice some of the data for an “unblinded” sample • May help to understand efficiency for multi-pulse events • Surface roughness • May affect properties of the signal • Region of sensitivity
Moving Trigger Simulation from Frequency Domain to Time DomainAmy Connolly and Stephen Hoover, graduate student • Currently, simulations model the trigger using only the frequency profile: • Integrate total peak voltage read by each channel in frequency domain • Pick a noise voltage from Gaussian distribution, add to signal • Compare that signal + noise to RMS noise in each channel • Threshold = 2.3 x VRMS • True system integrates signal in time domain • We have begun to build tools for a time domain simulation
What Narrow-Band Noise Looks Like in the Time Domain Noise only (no signal) in the band from 350 to 450 MHz: Simulation Generated by summing sin waves flat in frequency within the band, with random phases 1/BW a # of wiggles/envelope ¼ f0 / BW Plot by Stephen Hoover Essentially, the noise (at ~center frequency f0) is acting as a carrier, to the “signal” (the bandwidth)
Properties of Noise Sampled at Small Time Intervals The envelopes sampled at small intervals follow a Rician distribution But instantaneous voltage sampled at small intervals follows a Gaussian Pure noise Pure noise Noise + Signal Arbitrary Units (Signal=2 VRMSnoise) Noise + Signal (Signal=2 VRMSnoise) a (Volts) V (Volts)
ANITA Trigger Integrates Over a Longer Time Interval • Model the tunnel diode as an integrator with exponential response (t=3.75 ns) • Deadtime once a trigger is generated is 50 ns (flight system will have 12 ns) • Find good agreement with lab measurements • Encouraged by this, we are proceeding to model the tunnel diode’s response to an Askaryan signal Tunnel Diode Output Single Channel Trigger Rate Model Measurements
Modeling the Time-Dependent Pulse • Theorists calculate frequency-dependent electric field and cone width of signal emitted from the interaction (J. Alvarez-Muniz, et al., Phys.Rev.D62:063001,2000; J. Alvarez-Muniz, et al., Phys.Lett.B411:218-224,1997) Take Fourier transform of frequency profile to find V(t) • Creating efficiency curves for signals + noise at the payload • Will test time domain simulation against SLAC calibration data
Surface roughness & sastrugi • But: Google images are a highly biased sample! Slide by Peter Gorham, University of Hawaii
Traverse data on sastrugi Wavelengths in ANITA’s band are ~30 cm to 1.5 m Verticle feature size ~ wavelength Lateral feature size ~ few wavelengths
Studying the Effect of Surface Roughness on Signal TransmissionBrian Daub, Erik Everson, Mark Harrison, Martin Griswold (undergraduates),Amy Connolly and David Saltzberg • We have scaled down the problem to lab-bench size • Purchased diffusers with various “grits” • Use lens to make ~2o divergence • Measure transmission vs. incident angle • Laser, white light
Roughness of Diffusers 1000 grit 1000 grit • Measured feature sizes with high power microscope • Within order of magnitude of 632 nm laser, but we’d like to go finer
Incident angle on diffusing surface = 39° ,Grit 1500 Normalized Power Angle off specular (deg.) Towards the normal Features of Transmission from Rough Surfaces Grit 1500 shows feature sizes closest to wavelengths measured with ANITA ANITA sensitive to events near TIR Total internal reflection (TIR) glass! air at 42° “Specular” ray: follows Snell’s law • Signal is diffused over ~ § 10 deg. • Narrower at smaller angles of incidence • Transmission tends toward the normal • Closer to specular at smaller angles of incidence
Guided by Measurements, Simulating Impact of Roughness • Balloon observes not just one “ray” but many • Sum intensity measured by balloon • With roughness, a signal would contain contributions across a section of the Cerenkov cone
Some Observations Regarding Roughness and ANITA • Spreading out of the transmitted signal will clearly reduce the observed signal for events where the specular ray sits at the peak of the Cherenkov cone • Ability to observe an entire section of the Cherenkov cone increases sensitivity to events where specular is off-peak • Offset of transmission peak toward the normal may increase our sensitivity to events closer to the balloon • Roughness may allow us to observe events that would have been TIR (Nieto-Vesperinas,Sanchez-Gil, J.Opt.Soc.Am.A/Vol.9,No.3/March 1992) • Plan to transmit from a borehole to receivers on surface, ANITA payload- measure effect of roughness to compare Ordered rounded glass to get to higher incident angles Begun to grind our own diffusers to get to finer grits and closer to the level of Antarctic roughness