Download
1 / 31
320 likes | 449 Views
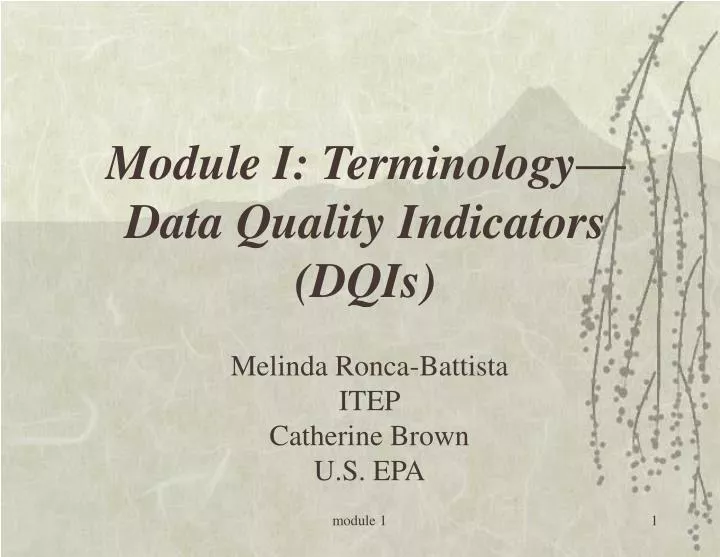
Module I: Terminology— Data Quality Indicators (DQIs). Melinda Ronca-Battista ITEP Catherine Brown U.S. EPA. DQIs Defined. DQIs are quantitative (objective numbers) and qualitative (subjective words) Precision Bias Representativeness Comparability Completeness Sensitivity.

E N D
Module I: Terminology— Data Quality Indicators(DQIs) Melinda Ronca-Battista ITEP Catherine Brown U.S. EPA module 1
DQIs Defined • DQIs are quantitative (objective numbers) and qualitative (subjective words) • Precision • Bias • Representativeness • Comparability • Completeness • Sensitivity module 1
DQIs Defined (cont.) • Quantitative DQIs • Precision, bias, and sensitivity • Qualitative DQIs • Representativeness, comparability, and completeness module 1
The Hierarchy of Quality Terms DQOs Data Quality Objectives Qualitative and quantitative study objectives Attributes Descriptive aspects of data DQIs Indicators (numbers) for the attributes MQOs Measurement Quality Objectives Acceptance criteria for the attributes measured by project DQIs module 1
Precision • Random errors or fluctuations in the measurement system (unavoidable wiggle) • Estimated by agreement among repeated measurements of same property under similar conditions or • Same conditions with identical instruments module 1
Precision module 1
Coefficient of Variation (COV) is another statistic to represent imprecision COV = coefficient of variation For collocated measurements Where s = sample standard deviation, or STDEV in Excel RPD = relative percent difference = module 1
Collocated Methods =IF(D2="yes",ABS((A2-B2)/C2)*100,"") module 1
Collocated Precision Begins with RPD (or COV) Plot values over time—is A always higher than B? If not, variability is good estimate of precision error module 1
Bias module 1
Bias Bias = how far from “truth” you are, in terms of a percentage Bias = your result – audit result audit result You have bias if, over time, you are always high, or always low (or always…) module 1
Principal Causes of Bias • Incomplete data (e.g., if all data only from end of week, less traffic, etc.) • Analytical –Calibration error –Sample contamination –Interferences (dandruff) • Sampling –Site operator always does same thing “wrong,” (e.g., upside down filter, changing a/c during audit) –Data retrieval error, so that negative values are reset to zero (causing positive bias) or instrument misread (esp. for manual QC checks’ screen reading) module 1
Estimating Bias Difference between measurement result and “reality” Can only be identified with external estimate of “reality” Maybe second flow rate standard best you can do Ideally, completely independent audits with another person and instrument (required for NAAQS determination) module 1
Manual PM Bias determined via PEP audits PEP considered “truth” Bias = consistent difference between audit results and field sampler results Can construct confidence intervals If always within limits for results of individual checks, must be within limits for average of differences over that time period module 1
Bias for Automated Methods module 1
Automated Methods Calculation made from QC results over time QC estimates used to fold both precision and bias into calculations; difficult to separate module 1
Bias Hidden as Variability 50 x x x x x x x x x x x x 40 x x x x x x x x x x x x x x x x x x x x x x x x x x 30 x x x x x x x x x x x x x x 20 10 A B 0 Is data set A or B a better representation of population? module 1
Bias Hidden as Variability (cont.) 50 x x x x x x x x x x x 40 x x x mean=38.5 x x x x x x x x x x x x x x x x x x x x x x x x 30 x x x x x x x x x x x x x x 20 10 A B 0 Both data sets have similar variability. Data set B is a biased representation of the population of interest module 1
Accuracy = Total Error • Composed of both precision and bias • Measure of long-term agreement of measurements to truth –Can only be measured over time—for any one measurement, random precision errors might be high or low –Over time, precision errors will average out, bias obvious • EPA policy: Use bias and precision, rather than accuracy, as separate measures module 1
Influence of Bias and Imprecision on Overall Accuracy Precise and biased Imprecise and unbiased Imprecise and biased Precise and unbiased module 1
Precision and Bias Summary Track diff/mean for collocated Track diff/known, when known, is “truth” Track individual results over time (positive and negative) Systematic positive or negative results show bias Variability shows imprecision Use simple statistics EPA’s statistics are in P&B DASC 2007.xls module 1
Representativeness module 1
Choice of Sampling Unit - What does a sample represent? A year 1 filter with 24 hours of material One month module 1
Representativeness Representativeness: measure of degree to which data suitably represent environmental condition e.g., 1 in 3 day results representative of air concentration to be found over how long a time period? How large an area? module 1
Comparability Qualitative confidence that two or more data sets may be compared • Data gathered with FRMs comparable • Strict network design (distance from roads, etc.) ensures comparability • Using SOPs from 1 person and 1 year to next helps ensure YOUR data set is comparable to dataset from another person and 1 year to next module 1
Completeness • Amount of valid data gathered, as a percentage of the number of valid measurements planned to meet DQOs module 1
Sensitivity Discerning the Signal in the Noise Response Concentration module 1
Sensitivity A. Capability to discriminate between different actual concentrations (or flow rates, etc.), or B. Capability of measuring a constituent at low levels –Practical Quantitation Level describes ability to quantify a constituent with known certainty e.g., PQL of .05 mg/L for mercury represents level where a precision of +/- 15% can be obtained module 1
For trace gas instruments, definitions are critical LDL (twice background noise) 40 CFR Part §53.23 (c) MDL (where can measure zero with 99% confidence) 40 CFR Part §136, App. B Zero drift (max diff over 12 hours) 40 CFR Part §53.23 (e)(i) Span drift (% change over 24 hrs of the same concentration) 40 CFR Part §53.23 (e)(ii) See MDL for gaseous.doc module 1
Mistakes are Common • 1993 study by Wisconsin DNR found 23 of 56 labs incorrectly calculated MDL • 1998 survey found 26% of submitted results incorrect module 1
Module 1 Summary Precision error = random error (“wiggle”) Bias error = systematic up or down (“jump”) Plot individual results over time Detection limits defined differently; specify calculations for lab, assess what lab routinely does by asking them for their method module 1