Download
1 / 16
170 likes | 180 Views
Determination of Reservoir Properties from XRF Elemental Data in the Montney Formation. Justin Besplug, Ron Spencer and Tom Weedmark - XRF Solutions - www.xrfsolutions.ca. ABSTRACT.

E N D
Determination of Reservoir Properties from XRF Elemental Data in the Montney Formation Justin Besplug, Ron Spencer and Tom Weedmark - XRF Solutions - www.xrfsolutions.ca
ABSTRACT Portable X-Ray Fluorescence (XRF) instruments allow a large amount of data to be obtained rapidly, with minimal sample preparation or drilling impact, and at low cost. Rock powders, cuttings, slabs or core faces can be analysed directly using this non-destructive technique. XRF analyses provide highly precise, and if calibrated properly, accurate data on the bulk chemistry. Proprietary normative mineral algorithms are applied in order to convert the elemental chemical data to mineralogy. Mineral abundances determined from the XRF analyses correlate well with those obtained by X-Ray Diffraction, thin section point counting and SEM analyses. The vast majority of the data fall within the 5% envelope expected from the precision of the XRD analyses when compared with XRF determined mineralogy. Mineralogy in the Montney is variable and the most abundant minerals are calcite, dolomite, quartz, feldspar and illite. Minor amounts of phosphate, anhydrite, pyrite, kaolinite and TOC are also present. Mineralogy and trace element data are used to determine reservoir properties through a set of semi-empirical equations. Porosity and mechanical properties, including Poisson’s ratio and Young’s modulus, determined by XRF algorithms correlate well with values obtained from wireline logs and lab analyses in vertical wells. Formation specific algorithms developed from vertical wells can be applied to cuttings analysed from horizontal production wells, where conventional log analyses are impractical or too expensive. The information obtained is particularly valuable for geosteering purposes if conducted on site in real time or for post well completion planning. Data obtained using portable X-Ray Fluorescence instruments provide a cost-effective means for optimization of both completions and production from horizontal wells. It takes approximately 2-3 days to collect 500 to 800 data points for a single core (~25cm spacing), and 1-2 days to collect data points from horizontal cuttings (5-10 m spacing). A major element profile, and spectral gamma profile for a Montney core are shown below. Major elements provide the building blocks for mineralogy and depth shifting can be applied by relating the XRF gamma to wireline or core gamma. Analyses displayed for the core data shown here were obtained at 25 cm spacing throughout; cuttings were analyzed at 5 m spacing. Although element profiles contain valuable information, geoscientists and engineers are more familiar with and work with mineralogy and reservoir properties rather than elemental composition. Therefore, a normative mineral algorithm is used to determine mineralogy from the elemental data.
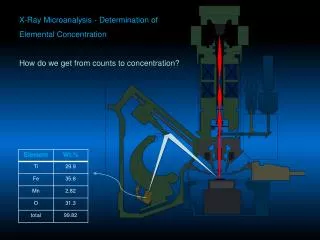
Major Elements (Core): Calibrated percentages by weight of the main rock forming elements are displayed. Note scales are different for each component.
Spectral Gamma (Core): The elemental concentrations of K, U, and Th are displayed as well as total gamma and calculated TOC content. Data collected from the XRF analyses are in blue while those acquired from wire line logs are in black.
MINERALOGY Most geoscientists and engineers that we work with are not familiar with elemental data. The use is generally limited to stratigraphic correlation. However, there is a significant body of data that, if converted to more familiar and more pertinent forms, provide a wealth of information. Reservoir properties are generally a function of the mineralogy and fabric of the rock, not simply the elemental composition. Determination of the mineralogy from the elemental data provides the user with a much more powerful tool. We employ the principles of mineralogy phase theory to construct normative mineral algorithms. XRF mineral calculations are compared to XRD results from a core below.
Mineralogy (Core): Percent by weight of calcite, dolomite, anhydrite, apatite, quartz, feldspar, illite/mica, kaolinite/chlorite, and pyrite determined by XRF normative mineral phase theory (continuous curves). Mineralogy determined by XRD are displayed as colored squares.
Examples of the XRF mineralogy model applied to two horizontal Montney wells are displayed below. The wells show similar ranges of mineral values to those of the vertical core, which provides confidence in cutting quality. Mineralogical changes can help determine stratigraphic location of the well, and be incorporated into post well completion planning. Mineralogy (Horizontals): Percent by weight of calcite, dolomite, anhydrite, apatite, quartz, feldspar, illite/mica, kaolinite/chlorite, and pyrite determined by XRF normative mineral phase theory.
TOC The detection of carbon is not possible with XRF because it is too light. However, there are several trace elements associated with organics that are detected and these are used to determine TOC. There are a number of trace elements and metals that can be used as proxies for TOC. We show two of these, U and Mo below. The pyrite profile is also shown as an indicator of reducing conditions whilst the Mn profile gives an indication of the oxidation state. TOC has been shown to have a large impact on porosity and mechanical properties in the Montney, with the potential of having solid bitumen in the rock.
TOC Potential (Core): Elements related to organics and redox are displayed. XRF TOC (red line) is a calculated value which indicates zones of higher and lower TOC. Lab measured TOC values overlay the calculated TOC curve. Note scales are different in each track.
The same parameters used to determine TOC and redox conditions in the core are applied to data from horizontal wells. These parameters tend to show far less variation in the horizontal wells then in the core as the horizontal wells penetrated limited stratigraphic intervals. TOC Potential (Horizontals): Elements related to organics and redox are displayed. XRF TOC (red line) is a calculated value which indicates zones of higher and lower TOC.
Mechanical Properties Mineral composition and rock fabric parameters are used to develop algorithms for modelling mechanical properties such as Poisson’s ratio and Young’s modulus. Mechanical properties are controlled by mineralogy and fabric. Understanding these relationships makes it possible to predict the mechanical properties. Mechanical properties of unconventional reservoirs are very important in exploitation of oil and gas reserves. If a rock is too ductile or too strong it may not be possible to induce hydraulic fractures, emplace proppant or to prevent closure of fractures that do propagate.
Mechanical Properties (Core): XRF developed Poisson’s Ratio & Young’s Modulus values are displayed. Rock mechanical values acquired through dipole sonic wire line logs and lab measurements are compared to the XRF values.
Mechanical Properties (Horizontals): XRF derived Poisson’s Ratio & Young’s Modulus values for the two horizontal wells are displayed. Quartz and feldspars are relatively brittle (low Poisson’s Ratio) with variable rock strength (Young’s Modulus). Calcite and dolomite have high Poisson’s Ratio and Young’s Modulus. Carbonate minerals are relatively ductile but also very strong. Where carbonates are present as cement it can lead to higher pressures during fracture attempts and in some cases the rocks appear to simply deform rather than break. Clay minerals in the Montney are dominated by illite and mixed Illite-rich clays. High concentrations of these clays have a negative impact on hydraulic fracturing by making the rock more ductile and allowing fractures to close over time due to embedment.
Reservoir Properties An XRF reservoir quality log suite is shown below for a core in the Montney Formation. The most important factors for proper evaluation of the target reservoir are gathered into one log suite. The key factors selected for this log suite are detrital framework components, total clay, total carbonate, mechanical properties, porosity and TOC. These are displayed along with resistivity and gamma wireline log data. These properties aid in the location of zones with the best reservoir properties. The parameters displayed in the reservoir quality log suite are determined from the proprietary phase theory and semi-empirical specific mineral interaction models.
Reservoir Quality (Core): Continuous colored curves show XRF derived information for mineral groups, mechanical properties, porosity and TOC. Wireline log GR and resistivity along with lab measured porosities (red squares) are also displayed.
Formation specific algorithms are developed from vertical well data. Once these are developed they are applied to data obtained on cuttings from horizontal wells as shown below. The information obtained is particularly valuable for geosteering purposes in real time and/or post well completion planning. Data obtained using portable X-Ray Fluorescence instruments provide a rapid cost-effective means for optimization of completions and production from horizontal wells. Reservoir Quality (Horizontals): Continuous colored curves show XRF derived information for mineral groups, mechanical properties, porosity and TOC. Wireline log GR and gas data are also displayed.