Download
1 / 29
290 likes | 303 Views
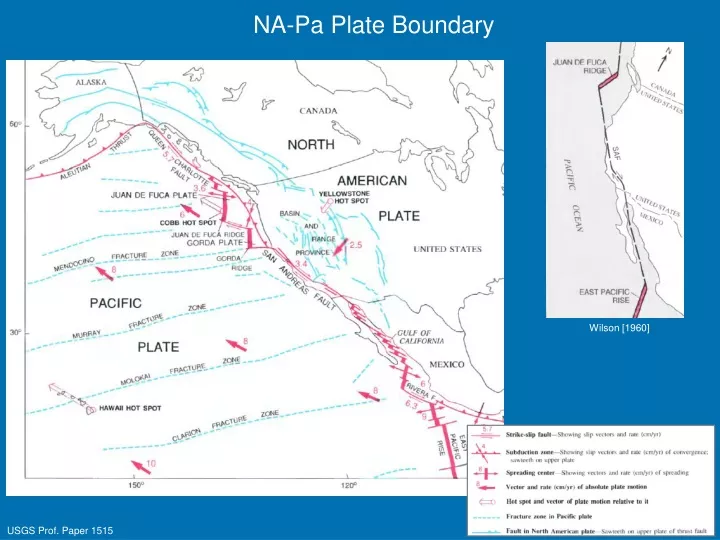
NA-Pa Plate Boundary. Wilson [1960]. USGS Prof. Paper 1515. Faults: Northern California. USGS Prof. Paper 1515. Faults: Southern California. USGS Prof. Paper 1515. SCEC Clickable Fault Map. http://www.data.scec.org/faults/faultmap.html. Evolution of North American - Pacific

E N D
NA-Pa Plate Boundary Wilson [1960] USGS Prof. Paper 1515
Faults: Northern California USGS Prof. Paper 1515
Faults: Southern California USGS Prof. Paper 1515
SCEC Clickable Fault Map http://www.data.scec.org/faults/faultmap.html
Evolution of North American - Pacific Plate Boundary USGS Prof. Paper 1515
Evolution of North American-Pacific Plate Boundary Modern SAF (4 Ma) & opening of Gulf CA USGS Prof. Paper 1515
Atwater Animation [Atwater and Stock, 1998]
“Captured” North American Plate • Inactive early transform with • component of subduction • Captured part of NA plate now • moving northwesterly with • Pacific plate USGS Prof. Paper 1515
Evolution of San Andreas 30-15 Ma 20-10 Ma 220 km 60 km 10-2 Ma 5-0 Ma 2-0 Ma 2-0 Ma USGS Prof. Paper 1515; Powell & Weldon [1992]
Displacement of Pelona Schist Pelona Schist Orocopia Schist USGS Prof. Paper 1515; Powell & Weldon [1992]
Displacement of Pelona Schist • 50 km right lateral slip by San Gabriel f. • 210 km right lateral slip by San Andreas f. USGS Prof. Paper 1515; Powell & Weldon [1992]
Fault Slip Rate USGS Prof. Paper 1515
Historical Faulting USGS Prof. Paper 1515
Seismicity (1980-86) USGS Prof. Paper 1515
Probability for occurrence of major earthquake from 1988-2018 USGS Prof. Paper 1515
Past and Future Earthquakes on the San Andreas Fault [Weldon et al., 2005] Wrightwood and the earthquake cycle... [Weldon et al., 2004]
Exposed Trench, Pallett Creek 1857 • Fault zone intermittently • covered by debris flows • and peat layers • Samples provide approx. • event dates & offsets A.D. 800 USGS Prof. Paper 1515
Wrightwood Trench fault/fissure stratigraphic contact Weldon et al. [2004]
Wrightwood Event Ages Mean recurrence interval: 105 yrs (31-165 yrs) Mean slip: 3.2 m (0.7-7m) Weldon et al. [2004]
Tests of Slip/Time Predictable Models Slip-predictable: length of interseismic period predicts amount of slip in next event Time-predictable: offset of the last event predicts the time length until the next event Weldon et al. [2004]
Strain-Predictable Model? Weldon et al. [2004]
Strain-Predictable Model? Weldon et al. [2004]
Beyond Wrightwood “The current 148-year hiatus is probably not exceptional. However, no lull in the past 1600 years appears to have lasted more than ~ 200 years, and when the current hiatus ends, a substantial portion of the fault is likely to rupture, either as a single long rupture or a series of overlapping ruptures in a short time interval.” Weldon et al. [2005]
Rupture Scenarios North and south ruptures w/overlap Random rupture length North 2/3’s rupture; south 1/3 rupture Long ruptures w/small additional ones 1. 3. 2. 4. Weldon et al. [2004, 2005]
Conclusions Strain released in an earthquake is not simply that accumulated since the last event. It appears likely that slip occurs at a wide range of strain levels and does not always release the same amount of strain. Overlapping tails of essentially separate large ruptures may explain two small events in a short interval of time at a point, but this cannot explain the 600-900 A.D. flurry of events with large displacements, or the past 1000 years of less-frequent, smaller-than-average events. Given the rupture lengths of 1812 and 1857 events (~150, 300 km) & lack of substantial rupture in last 148 years, many doubt the possibility of frequent, small ruptures on the southern SAF.
S. California Topography USGS Prof. Paper 1515