Download
1 / 39
570 likes | 843 Views
PROJECT QUALITY MANAGEMENT. OVERVIEW. Project Management Knowledge Area Project Integration Management Project Scope Management Project Time Management Project Cost Management Project Quality Management Project Human Resources Management Project Communication Management

E N D
PROJECT QUALITY MANAGEMENT Teknik Elektro FT UNDIP
OVERVIEW Project Management Knowledge Area Project Integration Management Project Scope Management Project Time Management Project Cost Management Project Quality Management Project Human Resources Management Project Communication Management Project Procurement Management Project Risk Management
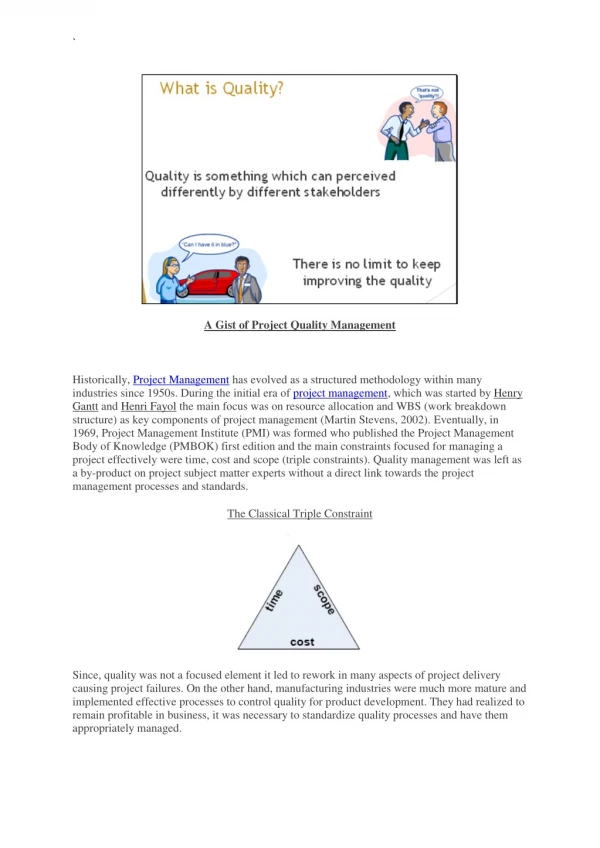
OVERVIEW How to Achieve Project Success? By balancing stakeholders’ competing demands for : Cost Time Scope Quality
PROJECT QUALITY MANAGEMENT Processes include all the activities of the performing organization that determine quality policies, objectives, and responsibilities so that the project will satisfy the needs for which it was undertaken
PROJECT QUALITY MANAGEMENT • Quality Planning Identifying which quality standards are relevant to the project and determining how to satisfy them 2. Perform Quality Assurance Applying the planned, systematic quality activities to ensure that the project employs all processes needed to meet requirements • Perform Quality Control Monitoring specific project results to determine whether they comply with relevant quality standards and identifying ways to eliminate causes of unsatisfactory performance
PROJECT QUALITY MANAGEMENT 3. Perform Quality Control • Quality Planning 2. Perform Quality Assurance
GOAL OF QUALITY PROGRAM • Fitness for use Product/service produced must satisfy real needs • Costumer satisfaction Product/service meet customer’s expectations • Conformance to the requirements The project must produce what it said it would produce
QUALITY CONCEPTS • Zero Defects No tolerance for errors within the system • The Customer Is The Next Person In The Process Conformance to requirements & customer satisfaction • Do The Right Thing Right The First Time Do it once in complete & correct manner • Continuous Improvement Plan – Do – Check – Action • Process Capability Capable of performing the required functions to achieve the desire outcome
QUALITY VS GRADE • QUALITY is the degree to which a set of inherent characteristic fulfill requirements • GRADE is a category assigned to products or services having the same functional use but different technical characteristics • LOW QUALITY is always problem, LOW GRADE is not necessary a problem
COST OF QUALITY • The total costs that incurred by investment in preventing nonconformance to requirements, appraising the product or service for conformance to requirements, and failing to meet requirement (rework) • Failure cost are often categorized into internal and external. Failure cost are also called cost of poor quality • There are three types of costs that are incurred: Prevention costs, Appraisal Costs, and Failure Costs
What is the Major Cost of Quality • Prevention cost • Appraisal cost • Internal failure cost • External failure cost • Measurement and test equipment.
% OF TURNOVER savings rework rework inspection inspection prevention prevention COST OF QUALITY BEFORE AND AFTER QUALITY INITIATIVE Before After
PROJECT QUALITY PLAN Should address, but not limited to : • Project Management Methods • Roles & Responsibilities • Deliverables & Milestones • Standards for Monitoring & Control Purposes • Process Reviews • Major Checkpoints • Inspection & Acceptance Criteria
QUALITY TEAM FOR A PROJECT SENIOR MANAGEMENT CLIENT REGULATORY AUTHORITIES PROJECT MANAGER VENDOR/SUPPLIER PROJECT STAFF SUBCONTRACTOR
QUALITY ASSURANCE VS QUALITY CONTROL • Quality Assurance only check whether it’s comply with the PROCESS, regardless result, etc. • Quality Control comply with RESULT !
Statistical Quality Control • Method used to measure variability in a product for evaluation and corrective actions. When the product exceeds the bounds of acceptability based on statistical inference the product can be rejected with reasonable assurance that it does not meet requirements.
Major systems which used in Statistical Quality Control • Process Control Charts • Acceptance Sampling
UCL = X LCL Control Chart 68.26% 95.46% 99.73%
UCL · · · · · · · · · = · · · · · X · · · · · · · · LCL Control Chart (in control)
UCL = X LCL Control Chart (Out-of-Control)
UCL = X LCL Control Chart (Hugging Control Limit)
UCL = X LCL Control Chart (Trend)
UCL = X LCL Control Chart (Cycle)
UCL = X LCL Control Chart (Run)
Rule of Seven • When any 7 consecutive reading on a chart are either above or below the median, but are still within the upper and lower control limits, the process is out of control. • When a process is out of control, management should be notified and is responsible to identify the cause and initiate corrective action.
The Tools of Modern Quality Management • The tools of modern quality management relate to problem solving through uniform processes that provide information which leads to recognizing process changes and correcting them. • Pareto diagrams • Cause and effect diagrams (fishbone diagram) • Histogram • Scatter diagrams • Graphs • Check sheets • Check Lists
PARETO DIAGRAM Is a histogram, ordered by frequency of occurrence, that shows how many results were generated by type or category of identified cause Rank ordering is used to guide corrective action Pareto’s Law : relatively small number of causes will typically procedure a long majority of the problems or defects (80/20)
BEFORE IMPROVEMENT AFTER IMPROVEMENT ( CASES ) ( CASES ) ( % ) 100 100 100 OVERALL 80 80 EFFECT ( % ) 75 100 60 60 No. of Defective Cases 75 No. of Defective Cases % of Composition % of Composition 50 40 40 50 25 20 20 25 0 0 0 0 Caulking Wobble Caulking Pressure Others Improper Rotation Wobble Wobble Improper Rotation Wobble Pressure Axle Case Noise Others Noise Axle Case PARETO DIAGRAMSAMPLE
MAJOR DEFECT TIME MACHINE METHOD MATERIAL USE : • Random Method ENERGY MEASUREMENT PERSONNEL ENVIRONMENT • Systematic Method • Process Analysis Method CAUSE EFFECT ALWAYS ASK: WHO? What? Where? When? Why? How? MACHINE METHOD MATERIAL TIME CORRECTIVE ACTION MEASUREMENT PERSONNEL ENVIRONMENT ENERGY USE : • Solution Analysis Method CAUSE AND EFFECT DIAGRAM(ISHIKAWA DIAGRAM/FISH BONE DIAGRAM)
Audix Exists LAN Directory Not Updated Audix Directory Line Busy Wrong Extension in Book At Lunch Call Comes Before/ After Hours Away from Desk Business Call Zero Out Not Established Re-direct issues Taking on Other Line At Meeting Personal Call Support Staff Has Audix CAUSE AND EFFECT DIAGRAMSAMPLE Reason Phone Not Answered Machinery Materials Phone Not Answer People Method