Download
1 / 59
600 likes | 813 Views
IT Project Quality Management. Quality. “an inherent or distinguishing characteristic ; a property; having a high degree of excellence” “fitness for use” “conformance to requirements” dependent on needs and expectations of customer. Project Quality Management (PQM) - PMBOK.

E N D
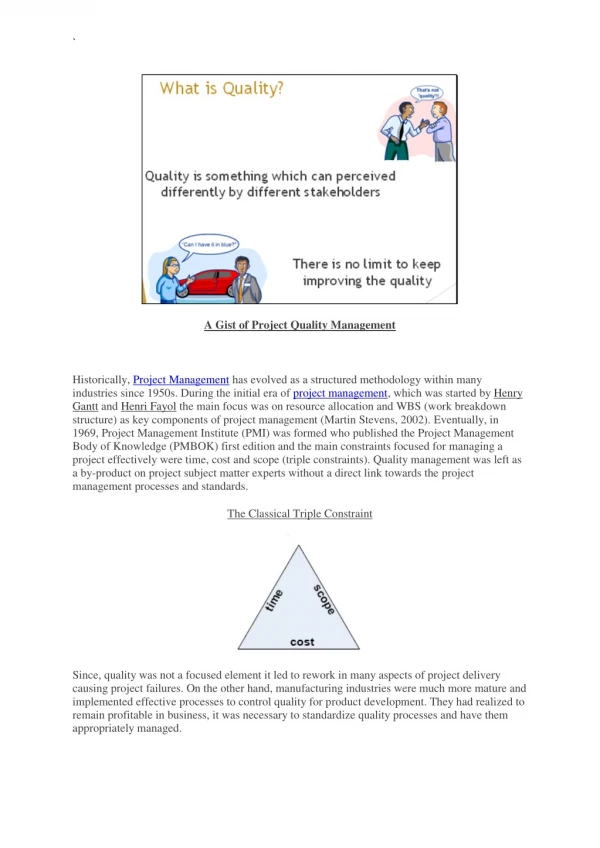
Quality • “an inherent or distinguishing characteristic ; a property; having a high degree of excellence” • “fitness for use” • “conformance to requirements” • dependent on needs and expectations of customer
Project Quality Management (PQM) - PMBOK • The processes required to ensure that the project will satisfy the needs for which it was undertaken. It includes all activities of the overall management function that determine the quality policy, objectives, and responsibility and implements them by means of quality planning, quality assurance, quality control, and quality improvement within the quality system.
PMBOK – Project Quality Management Process • Quality Planning • Determining which quality standards are important and how they will be met. • Quality Assurance • Evaluating overall project performance to ensure quality standards are being met. • Quality Control • Monitoring the activities and results of the project to ensure that the project complies with the quality standards.
PQM • Focuses on project’s products • project’s most important product is the information system solution that the project team must deliver • Focuses on project process • the activities, methods, materials, and measurements used to produce the product or service • part of a quality chain where outputs of one process serve as inputs to other project management processes
ISO Certification Six Sigma initiatives Awards Deming Prize Malcolm Badridge National Quality Award Capability Maturity Model (CMM) Shewhart Deming Juran Ishikawa Crosby Programs & People
The Quality Movement • Early humankind • Quality = Survival • Craftsmanship • In the middle ages guilds regulated: • Who could sell what in a particular town • Ensured standardized pricing and quality • Supported members & their families when members could no longer work • Regulated forms of labor • Masters – owned the shop • Apprentices – were bound to a master & learned the trade • Journeymen – completed training & waiting for a job opening!
The Quality Movement • The Industrial Revolution • Eli Whitney (1765 – 1825) • Invented the cotton gin • But also invented mass production • In 1798 received $134,000 from the US Government to deliver 10,000 rifles within 2 years • Shortage of gunsmiths • Developed the manufactory where machines could build interchangeable parts and men could learn to operate the machines • Took 10 years to deliver the last rifle, but proved that the concept worked!
The Quality Movement • Scientific Management - Fredrick W. Taylor (1856 – 1915) • Management would set arbitrary rules of thumb • Workers produced so much each day – no more, no less • Believed the production process could be more efficient and employed “Scientific Management” • Break a task down into smaller tasks & study it to find the best and most efficient way of doing it • Time – motion studies using stopwatch • Did not sit well with labor unions because many ignored the human factors & believed profits could be increased by speeding up the workers
The Quality Movement • Walter A. Shewhart (1891 – 1967) • Worked for Western Electric Company (Bell Telephones • Quality improvements needed for underground equipment • Applied statistical theory to control production processes
Quality Control Charts and the Seven Run Rule • A control chart is a graphic display of data that illustrates the results of a process over time. It helps prevent defects and allows you to determine whether a process is in control or out of control • The seven run rule states that if seven data points in a row are all below the mean, above, the mean, or increasing or decreasing, then the process needs to be examined for non-random problems
The Quality Movement • W. Edwards Deming (1900 – 1993) • Worked with Shewhart at Western Electric Hawthorne Plant in Chicago, IL in the 1920s • Management treated the worker as a cog in the machinery • Final inspection used to control quality • Worker not directly responsible • Scrap & rework reduced per piece rate • Invited to give series of day-long lectures in Japan in the 1950s • The rest is history…
Deming’s 14 Points Create constancy of purpose toward improvement of products and services, with the aim to become competitive and to stay in business, and to provide jobs. Adopt the new philosophy. We are in a new economic arena. Western management must awaken to the challenge, must learn their responsibilities, and take on leadership for change. Cease dependencies on inspection to achieve quality. Eliminate the need for inspection on a mass basis by building quality into the product in the first place. End the practice of awarding business on the basis of price tag. Instead minimize total cost. Move toward a single supplier for any one item, on a long-term relationship of loyalty and trust. Improve constantly and forever the system of production and service, to improve quality and productivity, and thus constantly decrease costs.
Deming’s 14 Points • Institute training on the job. • Institute leadership • Drive out fear, so that everyone may work effectively for the company. • Break down barriers between departments. • Eliminate slogans, exhortations, and targets for the workforce asking for zero defects and new levels of productivity • a) Eliminate work standards (quotas) on the factory floor. Substitute leadership b) Eliminate management by objective and by numbers. • Create pride in the job being done. • Institute a vigorous program of education and self-improvement. • Put everybody in the company to work to accomplish the transformation. From Out of the Crisis by W. Edwards Deming(1986)
The Quality Movement • Joseph Juran (1904 - ) • Viewed quality as “fitness for use” • Also invited to Japan to conduct seminars in the 1950s • Message is that quality does not happen by accident – it must be planned.
The Quality Movement • Juran’s Quality Planning Road Map (Quality Trilogy) • Quality Planning 1. Identify who are the customers. 2. Determine the needs of those customers. 3. Translate those needs into our language. 4. Develop a product that can respond to those needs. 5. Optimize the product features so as to meet our needs as well as customer needs. • Quality Improvement 6. Develop a process that is able to produce the product. 7. Optimize the process. • Quality Control 8. Prove that the process can produce the product under operating conditions. 9. Transfer the process to Operations.
The Quality Movement • Kaoru Ishikawa (1915 - ) • Studied under Deming • Believes quality is a continuous process that relies on all levels of the organization • Advocated the use of easy-to-use statistical tools • Ishikawa, or Fishbone Diagram • Pareto Diagram • Flow Charts
Pareto Analysis • Pareto analysis involves identifying the vital few contributors that account for the most quality problems in a system • Also called the 80-20 rule, meaning that 80% of problems are often due to 20% of the causes • Pareto diagrams are histograms that help identify and prioritize problem areas
The Quality Movement • Philip Crosby (1926 – 2001) • Advocated • “Do it right the first time” • “Zero defects” • “Quality is free” • “Non-conformance costs organizations money”
Quality Systems • International Organization for Standardization (ISO) • Derived from Greek word “isos,” meaning equal • Formed in 1947 • Today has over 130 members “to facilitate the international coordination and unification of industrial standards.” • Standards make up the ISO 9000 (organizations) and ISO 14000 (environmental) families
Quality Systems : ISO 9000 • Customer Focus • Leadership • Involvement of People • Process Approach • System Approach to Management • Continual Improvement • Factual Approach to Decision Making • Mutually Beneficial Supplier Relationships
Six Sigma Defined • Six Sigma is “a comprehensive and flexible system for achieving, sustaining and maximizing business success. Six Sigma is uniquely driven by close understanding of customer needs, disciplined use of facts, data, and statistical analysis, and diligent attention to managing, improving, and reinventing business processes.”* *Pande, Peter S., Robert P. Neuman, and Roland R. Cavanagh, The Six Sigma Way. New York: McGraw-Hill, 2000, p. xi
Basic Information on Six Sigma • The target for perfection is the achievement of no more than 3.4 defects per million opportunities • The principles can apply to a wide variety of processes • Six Sigma projects normally follow a five-phase improvement process called DMAIC
Quality Systems: 6 Sigma • Six Sigma framework (D-M-A-I-C cycle) • Define • Measure • Analyze • Improve • Control
DMAIC • Define: Define the problem/opportunity, process, and customer requirements • Measure: Define measures, collect, compile, and display data • Analyze: Scrutinize process details to find improvement opportunities • Improve: Generate solutions and ideas for improving the problem • Control: Track and verify the stability of the improvements and the predictability of the solution
Six Sigma and Statistics • The term sigma means standard deviation • Standard deviation measures how much variation exists in a distribution of data • Standard deviation is a key factor in determining the acceptable number of defective units found in a population • Six Sigma projects strive for no more than 3.4 defects per million opportunities, yet this number is confusing to many statisticians
Standard Deviation • A small standard deviation means that data cluster closely around the middle of a distribution and there is little variability among the data • A normal distribution is a bell-shaped curve that is symmetrical about the mean or average value of a population
Six Sigma Conversion Table The Six Sigma convention for determining defects is based on the above conversion table. It accounts for a 1.5 sigma shift to account for time and measures defects per million opportunities, not defects per unit.
Quality Systems :The Capability Maturity Model (CMM) • Software Engineering Institute (SEI) at Carnegie-Mellon University • a set of recommended practices for a set of key process areas specific to software development. • guidance as to how an organization can best control its processes for developing and maintaining software. • path for helping organizations evolve their current software processes toward software engineering and management excellence
Quality Systems: The Capability Maturity Model (CMM) • Immature Software Organization • Reactive in nature - Managers continually “fight fires” • Schedules & budgets are usually exceeded • Functionality & quality often compromised to meet schedules • Project success determined by who is or is not part of the project team • No basis for judging quality • Never seems to be enough time to address problem issues or improve the current processes
Quality Systems: The Capability Maturity Model (CMM) • Mature Software Organization • Proactive and able to follow a set of disciplined processes throughout the software project. • Software processes and the roles of individuals are defined explicitly and communicated throughout the organization. • Software processes are consistent throughout the organization and continually improved based on experimentation or experiences.
Quality Systems: The Capability Maturity Model (CMM) • Mature Software Organization • Quality of each software process is monitored so that the products and processes are predictable across different projects. • Budgets and schedules are based on past projects so they are more realistic and the project goals and objectives are more likely to be achieved.
Quality Systems : The Capability Maturity Model (CMM) • Level 1: Initial - Characterized by an immature software organization in which the software process is ad hoc and often reactive to crises. Does not have a stable environment for software projects, and success of a project rests largely with the people on the project and not the processes that they follow.
Quality Systems: The Capability Maturity Model (CMM) • Level 2: Repeatable - Basic policies, processes, and controls for managing a software project are in place. Previous project successes can be repeated by other project teams on other projects. • Level 3: Defined - Software engineering and management processes are documented and standardized throughout the organization and become the organizations standard process.
Quality Systems: The Capability Maturity Model (CMM) • Level 4: Managed - Quantitative metrics for measuring and assessing productivity and quality are established for both software products and processes which are characterized as being quantifiable and predictable. • Level 5: Optimizing- At the highest level of software process maturity, the whole organization is focused on continuous process improvement.
The Cost of Quality • The cost of quality is • the cost of conformance or delivering products that meet requirements and fitness for use • the cost of nonconformance or taking responsibility for failures or not meeting quality expectations
Five Cost Categories Related to Quality • Prevention cost: the cost of planning and executing a project so it is error-free or within an acceptable error range • Appraisal cost: the cost of evaluating processes and their outputs to ensure quality • Internal failure cost: cost incurred to correct an identified defect before the customer receives the product • External failure cost: cost that relates to all errors not detected and corrected before delivery to the customer • Measurement and test equipment costs: capital cost of equipment used to perform prevention and appraisal activities
Organization Influences, Workplace Factors, and Quality • A study by DeMarco and Lister showed that organizational issues had a much greater influence on programmer productivity than the technical environment or programming languages • Programmer productivity varied by a factor of one to ten across organizations, but only by 21% within the same organization • The study found no correlation between productivity and programming language, years of experience, or salary • A dedicated workspace and a quiet work environment were key factors to improving programmer productivity
Quality Philosophies and Principles • Focus on customer satisfaction • Prevention not inspection • Improve the process to improve the product • Quality is everyone’s responsibility • Fact-based management