Download

1 / 34
350 likes | 521 Views
Credible Intervals, Bayes Theorem + Diagnostic Tests. Outline. Credibile Intervals Posterior Distribution and Bayes Theorem Sensitivity Specificity Positive Predictive Value ROC curve. See Pagano- Chapter 6- section 1-4. Credibile Intervals. For Prob(Smoking)=p in a Population:

E N D
Outline • Credibile Intervals • Posterior Distribution and Bayes Theorem • Sensitivity • Specificity • Positive Predictive Value • ROC curve See Pagano- Chapter 6- section 1-4
Credibile Intervals • For Prob(Smoking)=p in a Population: • p could be 0.05, 0.10, … 0.90, 0.95,1 • Prob of p: (prior probability) • Data: x=4 out of n=10 people smoke • Get Posterior Distribution using Bayes Theorem • Credible Interval: 95% Credible Interval: 2.5th and 97.5th percentile of posterior distribution • Example: Suppose the prior probability is the same for all p (uniform prior) Posterior Distribution Credible Interval
Diagnostic Tests • Diagnostic tests are routinely used to detect disease • Events related to individual’s health status: • Individual has disease (D) • Individual is disease free (Dc) • Outcomes of a diagnostic test: • Positive test result (T+) • Negative test result (T-)
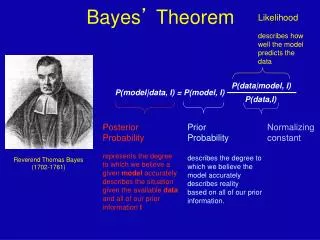
Diagnostic Tests Diagnostic tests D = “have disease” Dc =“do not have disease” T+=“positive screening result” Find the probability that an individual who tests positive actually has disease Find P(D |T+)
Diagnostic Tests • Positive predictive value = P(D | T+) • Sensitivity = P(T+ | D) • Specificity = P(T- | Dc ) • Prevalence = P(D)
Example: Cotinine levels andsmoking • Outcome of interest – Smoking status • Problem: People may not report honestly • Cotinine level may provide ‘objective’ asessment of smoking • Cotinine levels don’t work perfectly • Diagnostic test – Concentration of cotinine • i.e. If Cotinine level > c Smoker • If Cotinine level <= c NonSmoker
Example: Cotinine levels andsmoking Choose cutpoint using points closest to perfect. Perfect