Download
1 / 22
220 likes | 369 Views
National Center on Immigrant Integration Policy. Overview of US Immigration and Immigrant Integration May 31, 2008 Jeanne Batalova Migration Policy Institute. Key Global Migration Facts.

E N D
National Center on Immigrant Integration Policy • Overview of US Immigration and Immigrant Integration • May 31, 2008 • Jeanne Batalova • Migration Policy Institute
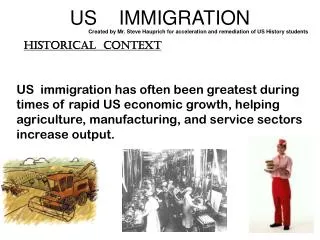
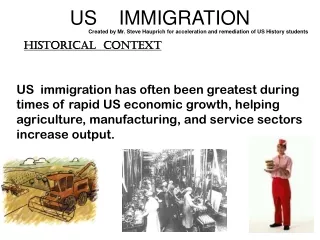
Key Global Migration Facts • In 2005, 190 million individuals (nearly 3% of the world’s population) lived outside their country of birth. • 28 countries host 75% of all migrants worldwide but virtually every country is a player or a “wannabe.” • In the next 25 years, more people will move due to: • Demographics both at origin and destination. • Labor needs practically across the wage and skills continuums. • Increasing economic interdependence and social interactions. • Long-term habits of emigration and immigration. • The powerful effects of sophisticated networks.
Countries with the Highest Numbers of Immigrants in 2005 *As countries collect statistics on immigrants in varying ways, it is often difficult to harmonize them across countries; differences in counting deeply affect rank orders. **Both countries are newcomers (less than 10 years old) in the big migration stakes. Source: United Nations, Trends in Total Migrant Stock: The 2005 Revision, data in digital form, 2006.
Immigrant Density (foreign born per capita) in 2005 *Differing counting methodologies make true comparisons difficult. Source: United Nations, Trends in Total Migrant Stock: The 2005 Revision, data in digital form, 2006.
Almost Half Metro Areas with 1 Million+ Immigrants Are in the US
Toronto Metropolitan Area Number of immigrants: 2.1M Los Angeles Metropolitan Area Number of immigrants: 3.4M Urban Diversity (2005): Immigrants in LA and Toronto Source: Analysis by the Migration Policy Institute.
Over 40 Million (2010) 37.5 Million (2006) 14.8% 13+ Percent (2010) 12.5% (2006) 4.7% 37.5 Million Immigrants in 2006:12.5 % of US Population Source: US Census Bureau’s data; Analyses by the Migration Policy Institute and the Urban Institute.
Shifting Immigrant Origins 1960 and 2006 Source: US Census Bureau data; Analyses by the Migration Policy Institute.
Asian Immigrants in the US 1960 to 2006 Source: US Census Bureau data; Analyses by the Migration Policy Institute.
More States Feel the Impact of Immigration: Largest and Fastest Growing Immigrant States
Children of immigrants are ... Immigrants are ... • 23% Allchildren • 30% Alllow-income children • 1 in 8 US residents • 1 in 2 new workers in 1990s Demographic Impacts
Immigrants are: 1 in 5 low-wage workers* 1 in 2 low-skilled workers* 1 in 4doctors** 2 in 5medical scientists** 1 in 3computer software engineers** 1 in 5computer programmers** Immigrants in US Work Force (2005/2006) Source: American Community Survey (pooled 2005-2006); MPI and Urban Institute’s analyses. Notes: *Refers to persons age 18 and above. Low-wage workers earned less than twice the federal minimum wage in 2004. Low-skilled workers are those with less with a high school education.**Refers to persons in the civilian labor force, ages 25 and older.
One in Three Immigrants is Unauthorized Legal permanent residents (LPRs) 28% Unauthorized migrants 30% Refugees 7% Legal temporary residents 3% Naturalized citizens 31% 37.0 Million Foreign Born in 2005 Source: Urban Institute’s estimations.
Almost Half of All Immigrant Workers are LEP Percent of full-time immigrant workers who are limited English proficient (LEP) Source: American Community Survey 2005. Refers to workers ages 25 and older.
Skill Underutilization? Share of College Educated in Unskilled Occupations Natives vs. foreign-educated immigrants United States Note: *"Recent" refers to immigrants who arrived in the United States ten or fewer years ago, while "long term" are immigrants who have been for 11 years or longer. Europe refers to Europe, Canada, and Oceania. Source: MPI analysis of 2005-2006 ACS.
Immigrants’ Share: 15 Occupations With FastestGrowth 5.5 62.6 4.7 60.9 16.9 17.4 14.3 18.2 14.9 9.8 *** Occupations requiring at least an Associate’s degree. Source: MPI’s tabulations of ACS 2006 & BLS 2006-2016 occupational projections
Immigrants’ Share: 15 Occupations with Largest Growth *** Occupations requiring at least an Associate’s degree. Source: MPI’s tabulations of ACS 2006 & BLS 2006-2016 occupational projections
Rate of Total and LEP Enrollment Growth:From 1995 to 2005 Year United States LEP Enrollment Total Enrollment Source: National Clearinghouse for English Language Acquisition & Language Instruction Educational Programs (NCELA), 2006
ELL Enrollment (2004-2005): Top 10 School Districts Source: National Clearinghouse for English Language Acquisition & Language Instruction Educational Programs (NCELA), 2006.
Major Challenges • High rates of illegal immigration • Lack of alignment with regional/local workforce needs and labor market trends • Unmet integration needs: • Education • Adult English and education • Access to health care
Find reports and other analysisby state and for the nation at For More Information www.migrationpolicy.org Get quick immigration facts, maps, and stats at www.migrationpolicy.org/datahub *********************************************************** Jeanne Batalova, PhD Policy Analyst and Data Manager jbatalova@migrationpolicy.org