Download
1 / 50
500 likes | 704 Views
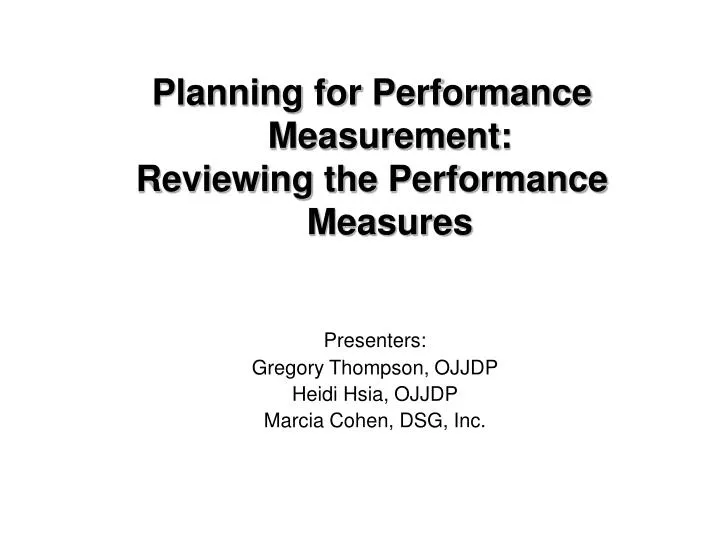
Planning for Performance Measurement: Reviewing the Performance Measures. Presenters: Gregory Thompson, OJJDP Heidi Hsia, OJJDP Marcia Cohen, DSG, Inc. Reporting Requirements. Output : All mandatory (bold) and two non-mandatory output measures.

E N D
Planning for Performance Measurement: Reviewing the Performance Measures Presenters: Gregory Thompson, OJJDP Heidi Hsia, OJJDP Marcia Cohen, DSG, Inc.
Reporting Requirements • Output:All mandatory (bold) and two non-mandatory outputmeasures. • Outcome:All mandatory (bold) and two non-mandatory measures.* *Except Core Requirements and JJ System Improvement require only one non-mandatory measure.
Key to Logic Models and Grid Charts Bold = Mandatory measure * = Mandatory only for intervention programs ** = Mandatory only for prevention programs
Output Objective Categories • Six types of output objectives: • Increase organizational/system capacity • Improve planning and development • Improve program quality • Improve program activities • Improve program efficiency • Improve the monitoring of compliance
Outcome Objective Categories • Nine types of outcome objectives: • Reduce delinquency • Increase accountability • Improve system effectiveness • Increase prosocial behaviors • Increase program support • Increase compliance with Core Requirements • Reduce disproportionate minority contact • Improve school climate • Improve the management of the State Juvenile • Justice and Delinquency Prevention • program
Mandatory Output Measures for Prevention and Intervention Programs • Title V or FG $ allocated for services: • The amount of Formula Grants and Title V funds in whole dollars that are allocated for delinquency prevention services during the reporting period. Program records are the preferred data source.
Mandatory Output Measures for Prevention and Intervention Programs (cont’d) • Number of program youths served: • An unduplicated count of the number of youths served by the program during the reporting period. Number served should be determined by subtracting out youths who dropped out/completed program/or were discharged/ terminated during the reporting period and adding in new admissions during the reporting. Include all youths who received at least one program service and met the program’s minimum criteria for participation. Program records are the preferred data source.
Mandatory Outcome Measures for Prevention** Programs • Number and percent of program youths exhibiting desired change in targeted behaviors: • Substance use • School attendance • Antisocial behavior • Family relationships • Pregnancies Note: Double ** denotes mandatory for prevention programs
Mandatory Outcome Measures for Intervention* Programs • Number and percent of program youths who offend or reoffend: • The number of program youths who were rearrested or seen at juvenile court for a new delinquent offense. Appropriate for any youth-serving program. Note: Single * denotes mandatory for intervention programs
Mandatory Outcome Measures for Prevention and Intervention Programs • Number and percent of youth completing program requirements: • The number and percent of program youth who have successfully fulfilled all program obligations and requirements. Program obligations will vary by program but should be a predefined list of requirements or obligations that clients must meet prior to program completion. Program records are the preferred data source.
Example: Probation Program Area
Sample Logic Model: PA 24—Probation OUTCOME MEASURES ACTIVITIES OUTPUT MEASURES SHORT-TERM LONG-TERM PROBLEM SUBPROBLEM(S) #/% of program youths who offend or reoffend #/% of program youths who offend or reoffend FG $ allocated for services # of planning activities conducted # of MOUs developed # of program slots available # of FTEs funded with FG $ #/% of program staff trained # of hours of program staff training provided Use of best practice model (Y/N) # of program materials developed # of program/agency policies or procedures, created, amended, or rescinded Delinquency INTERVENTION PROGRAM (Deficiency or lack of adequate probation programs) Conduct Planning Activities and Implement Program(s) #/% of program youths committed to correctional facility #/% of program youths committed to correctional facility Goals #/% of program youths charged with formal probation violation Objectives To improve JJ systems by increasing compliance with the Core Requirements and increasing the availability and types of prevention and intervention programs #/% of program youths exhibiting desired change in targeted behaviors (e.g., substance use, school attendance, antisocial behavior, family relationships, social competencies) To support both State and local intervention efforts and JJ system improvements Monitor Program(s) # of program youths served Average length of stay in program # of service hours completed Performance measures should report on those activities funded by Title II (Formula Grants) funds. #/% of program youths completing program requirements #/% of program staff with increased knowledge of program area Outcome Measure Definitions Short Term:Occurs during the program or by the end of the program Long Term:Occurs 6 months to 1 year after program completion • Long-Term Outcome Objectives • Reduce delinquency • Increase accountability • Short-Term Outcome Objectives • Reduce delinquency • Improve prosocial behaviors • Increase accountability • Increase program support • Output Objectives • Increase organizational capacity • Improve planning & development • Improve program quality • Improve program activities • Improve program efficiency Key = System-level indicator = Individual-level indicator = Objectives Bold= Mandatory measure
Sample Grid Chart: PA 24—Probation Output Performance Measures PROGRAM AREA 24. Probation OUTPUT PERFORMANCE MEASURES
Sample Grid Chart: PA 24—Probation Outcome Performance Measures
Example: Delinquency Prevention Program Area
Sample Logic Model: PA 09—Delinquency Prevention OUTCOME MEASURES ACTIVITIES OUTPUT MEASURES SHORT-TERM LONG-TERM PROBLEM SUBPROBLEM(S) FG $ allocated for services # of MOUs developed # of planning activities conducted # of program slots available # of FTEs funded with FG or TV $ #/% of program staff trained # of hours of program staff training provided Use of best practice model (Y/N) # of program materials developed # of program/agency policies or procedures, created, amended, or rescinded #/% of program youths exhibiting desired change in targeted behaviors (e.g., substance use, school attendance, antisocial behavior, family relationships, pregnancies) #/% of program youths exhibiting desired change in targeted behaviors (e.g., substance use, school attendance, antisocial behavior, family relationships, pregnancies) Delinquency PREVENTION PROGRAM (Deficiency or lack of adequate delinquency prevention programs) Conduct Planning Activities and Implement Program(s) Goals #/% of program youths completing program requirements Objectives To improve JJ systems by increasing compliance with the Core Requirements and increasing the availability and types of prevention and intervention programs To support both State and local intervention efforts and JJ system improvements #/% of youths satisfied with program #/% of program families satisfied with program Monitor Program(s) # of program youths served #/% of parents served Average length of stay in program # of service hours completed #/% of program staff with increased knowledge of program area Performance measures should report on those activities funded by Title II (Formula Grants) funds. Outcome Measure Definitions Short Term:Occurs during the program or by the end of the program Long Term:Occurs 6 months to 1 year after program completion • Long-Term Outcome Objectives • Improve prosocial behaviors • Short-Term Outcome Objectives • Improve prosocial behaviors • Increase program support • Increase accountability • Output Objectives • Increase organizational capacity • Improve planning & development • Improve program quality • Improve program activities • Improve program efficiency Key = System-level indicator = Individual-level indicator = Objectives Bold= Mandatory measure
Sample Grid Chart: PA 09—Delinquency Prevention Output Performance Measures
Sample Grid Chart: PA 09—Delinquency Prevention Outcomes Performance Measures
Core Requirements Program Areas
Mandatory Output Measures forCore Requirements Programs • FG funds allocated: • The amount of Formula Grants money in whole dollars that is allocated for the separation requirement during the reporting period. Program records are the preferred data source.
Mandatory Output Measures for Core Requirements Programs (cont’d) • Number of programs implemented: • The number of programs created and/or implemented during the reporting period. Program records are the preferred data source.
Mandatory Outcome Measure for Core Requirements Programs Change in the number of violations The change in the number of violations of the sight and sound requirement from the previous reporting period compared with the current reporting period. Sight and sound compliance is determined according to the definition in the OJJDP Guidance Manual for Monitoring Facilities Under the JJDP Act of 2002. The Annual Compliance Monitoring Report is the preferred data source.
Example: Separation Program Area
Sample Logic Model: PA 28—Separation ACTIVITIES OUTPUT MEASURES OUTCOME MEASURES SUBPROBLEM(S) CORE REQUIREMENT (Ensuring/monitoring compliance with the Separation Core Requirement) Conduct Planning and Oversight Activities Implement Processes and/or Programs FG $ allocated for separation # of MOUs developed Needs assessment completed (Y/N) #/% of programs implemented # of transportation plans developed # of shelter beds contracted #/% of staff trained # of hours of staff training provided # of materials developed # of program policies/procedures created, amended, or rescinded Change in the number of violations of sight and sound separation #/% of staff with increased knowledge of program area (e.g., separation regulations) Objectives To support both State and local prevention and intervention efforts and JJ system improvements Monitor Processes and/or Programs #/% of site visits conducted # of facilities receiving TA • Output Objectives • Improve monitoring of compliance • Increase organizational capacity • Improve planning & development • Outcome Objectives • Increase compliance with core requirements • Increase program support Key = System-level indicator = Individual-level indicator = Objectives Bold= Mandatory measure PROBLEM Delinquency Goals To improve JJ systems by increasing compliance with the Core Requirements and increasing the availability and types of prevention and intervention programs. Performance measures should report on those activities funded by Title II (Formula Grants) funds. Outcome Measure Definitions Reported Annually.
Sample Grid Chart: PA 28—Separation Output Performance Measures
Sample Grid Chart: PA 28—Separation Outcome Performance Measures
Example: Compliance Monitoring Program Area
Sample Logic Model: PA 06—Compliance Monitoring ACTIVITIES OUTPUT MEASURES OUTCOME MEASURES SUBPROBLEM(S) CORE REQUIREMENT (Ensuring/monitoring compliance with Section 223 (a)(14) of the JJDP Act of 2002) Funds allocated to adhere to Section 223 (a)(14) of the JJDP Act of 2002 # of activities that address compliance with Section 223 (a)(14) of the JJDP Act of 2002 # of MOUs developed #/% of program staff trained # of hours of program staff training provided # of program materials developed # of program policies/procedures created, amended, or rescinded # of facilities receiving technical assistance Submission of complete Annual Monitoring Report to OJJDP Conduct Planning and Oversight Activities #/% of staff with increased knowledge of program area (e.g., compliance monitoring) Objectives To support both State and local prevention and intervention efforts and JJ system improvements • Output Objectives • Improve monitoring of compliance • Increase organizational capacity • Improve planning & development • Outcome Objectives • Improve the management of the State JJDP Program • Increase program support Key = System-level indicator = Individual-level indicator = Objectives Bold= Mandatory measure PROBLEM Delinquency Goals To improve JJ systems by increasing compliance with the Core Requirements and increasing the availability and types of prevention and intervention programs Performance measures should report on those activities funded by Title II (Formula Grants) funds. Outcome Measure Definitions Reported Annually.
Sample Grid Chart: PA 06—Compliance Monitoring Output Performance Measures
Sample Grid Chart: PA 06—Compliance Monitoring Outcome Performance Measures
Sample Logic Model:PA 10 – Disproportionate Minority Contact OUTCOME MEASURES SUBPROBLEM(S) ACTIVITIES OUTPUT MEASURES Short-Term Long-Term FG $ allocated for DMC at the State and local levels # of FTEs funded with FG or TV $ # of activities conducted # of programs implemented #/% of program staff trained # of hours of program staff training provided # of materials developed # of program/agency policies or procedures, created, amended, or rescinded # of objective decision-making tools developed Number of agencies with improved data collection systems % of contact points reporting reduction in diproportionality at state level CORE REQUIREMENT (Ensuring compliance with the DMC Core Requirement) Conduct Planning Activities & Implement Program(s) and Processes #/% of recommendations implemented from assessment studies % of contact points reporting reduction in diproportionality at local level Number of minority staff hired INTERVENTION PROGRAM (Deficiency or lack of adequate intervention programs to reduce DMC) #/% of state agencies reporting improved data collection systems #/% of program youth who offend or reoffend # of local agencies reporting improved data collection systems #/% of program youth exhibiting a desired change in targeted behaviors (e.g., substance use, school attendance, family relationships, and antisocial behavior) PREVENTION PROGRAM (Deficiency or lack of adequate delinquency prevention programs) * #/% of program youth who offend or reoffend Monitor Program(s) and/or Programs # of program youth served Average length of stay in program # of service hours completed #/% of site/TA visits conducted #/% of program youth completing program Objectives #/% of program youth satisfied with program To support both State and local prevention and intervention efforts and JJ system improvements to reduce DMC #/% of program families satisfied with program #/% of program staff with increased knowledge of program area • Output Objectives • Improve monitoring of compliance • Increase system capacity • Improve program quality • Improve planning and development • Outcome Objectives • Reduce DMC • Improve system effectiveness • Increase program support • Reduce delinquency Key = system-level indicator = individual-level indicator = objectives Bold= mandatory measure PROBLEM Delinquency Goals To improve JJ systems by increasing compliance with the Core Requirements and increasing the availability and types of prevention and intervention programs Performance Measures should report on those activities funded by Title II (Formula Grants) funds. Outcome Measure Definitions Short-Term:Occurs during the program or by the end of the program Long-Term:Occurs 6 months to 1 year after program completion
Sample Grid Chart: PA 10—Disproportionate Minority Contact Output Performance Measures
Sample Grid Chart: PA 10—Disproportionate Minority Contact Outcome Performance Measures
Mandatory Output Measure for JJ System Improvement Programs • Number of grants funded with Formula Grants funds: • The number of grants funded with Formula Grants funds during the reporting period.
Mandatory* Output Measures for JJ System Improvement Programs • Number of programs implemented • Number of program youth served • Number of subgrants awarded • Number of grant applications reviewed and commented upon * If applicable (if not applicable, select another non-mandatory measure)
Mandatory* Outcome Measures for JJ System Improvement Programs • Number/percent of youth completing program • Number/percent of youth exhibiting desired changed in targeted behaviors • Average length of time between initial appearance and disposition • Number of programs funded directly in line with 3-year Plan • Number of Plan recommendations implemented • Number of allegations of civil rights violations filed • Number/percent of court hearings attended by an advocate * If applicable (if not applicable, select another non-mandatory measure)
Example: State Advisory Group (SAG) Program Area
Mandatory Output Measures for SAG Program Area • Number of grants funded with Formula Grants funds: • The number of grants funded with Formula Grants funds during the reporting period.
Mandatory Output Measures for (SAG) Program Area • Number of grant applications reviewed and commented on: • The number of grant applications reviewed and commented on to guide the development of juvenile justice programming in the State.
Mandatory Outcome Measure forSAG Program Area • Number and percent of Plan recommendations implemented: • Number and percent of SAG recommendations for the State Plan implemented during the reporting period. The preferred data source is • committee meeting minutes.
Sample Logic Model: PA 31—State Advisory Group (SAG) Allocation ACTIVITIES OUTPUT MEASURES OUTCOME MEASURES PROBLEM SUBPROBLEM(S) Delinquency JUVENILE JUSTICE SYSTEMS IMPROVEMENT (Need for effective SAG activities) # of grants funded with Formula Grants funds # of SAG committee and subcommittee meetings held Annual Report submitted to the Governor #/% of SAG members trained # of grant applications commented on #/% of activities/meetings that involve youth # of units of local government consulted during implementation of the 3-Year Plan #/% of programs using best practice model % of SAG allocation used # of SAG members contributing to plan or plan update #/% Plan recommendations implemented Conduct Planning and Oversight Activities # of FG-funded programs sustained after 3 years Goals Objectives #/% of SAG members who show increased knowledge of the program areas (for which they have oversight) To improve JJ systems by increasing compliance with the Core Requirements and increasing the availability and types of prevention and intervention programs To support both State and local prevention and intervention efforts and JJ system improvements • Output Objectives • Improve planning and development • Improve program efficiency • Improve program quality • Outcome Objectives • Increase compliance with Core Requirements • Increase program support Key = System-level indicator = Individual-level indicator = Objectives Bold= Mandatory measure Performance measures should report on those activities funded by Title II (Formula Grants) funds. Outcome Measure Definitions Reported Annually.
Sample Grid Chart: PA 31—State Advisory Group Output Performance Measures
Sample Grid Chart: PA 31—State Advisory Group Outcome Performance Measures
Formula Grants Performance Measurement Implementation Timeline (First year) April 1, 2005 Reporting period begins Sept. 30, 2005 Reporting period ends Dec. 31, 2005 Data report due to OJJDP
Formula Grants Performance Measurement Implementation Timeline (Second and Subsequent Years) Oct. 1, 2005 Reporting period begins Sept. 30, 2006 Reporting period ends Dec. 31, 2006 Data report due to OJJDP
Title V Performance MeasurementImplementation Timeline (First year) January 1, 2005 Reporting period begins Sept. 30, 2005 Reporting period ends Nov. 30, 2005 Data reports due to OJJDP March 31, 2006 FY 2005OJJDP Report to Congress due
Title V Performance MeasurementImplementation Timeline(Second and Subsequent Years) October 1, 2005 Reporting period begins Sept. 30, 2006 Reporting period ends Nov. 30, 2006 Data reports due to OJJDP March 31, 2007 FY 2006OJJDP Report to Congress due
Performance MeasurementTools and Support • Web site: • www.dsgonline.com/performance_measures.htm • Training • Technical assistance