Download
1 / 1
10 likes | 145 Views
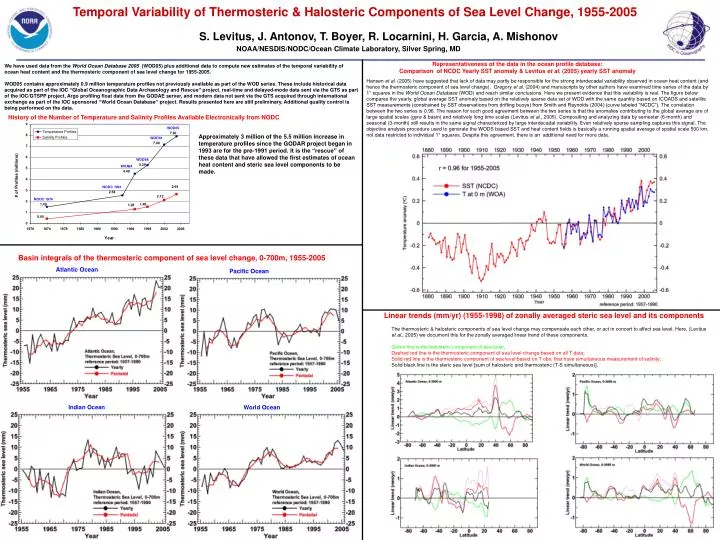
S. Levitus, J. Antonov, T. Boyer, R. Locarnini, H. Garcia, A. Mishonov. NOAA/NESDIS/NODC/Ocean Climate Laboratory, Silver Spring, MD. Representativeness of the data in the ocean profile database: Comparison of NCDC Yearly SST anomaly & Levitus et al. (2005) yearly SST anomaly.

E N D
S. Levitus, J. Antonov, T. Boyer, R. Locarnini, H. Garcia, A. Mishonov NOAA/NESDIS/NODC/Ocean Climate Laboratory, Silver Spring, MD Representativeness of the data in the ocean profile database: Comparison of NCDC Yearly SST anomaly & Levitus et al. (2005) yearly SST anomaly We have used data from the World Ocean Database 2005 (WOD05) plus additional data to compute new estimates of the temporal variability of ocean heat content and the thermosteric component of sea level change for 1955-2005. WOD05 contains approximately 0.9 million temperature profiles not previously available as part of the WOD series. These include historical data acquired as part of the IOC “Global Oceanographic Data Archaeology and Rescue” project, real-time and delayed-mode data sent via the GTS as part of the IOC/GTSPP project, Argo profiling float data from the GODAE server, and modern data not sent via the GTS acquired through international exchange as part of the IOC sponsored “World Ocean Database” project. Results presented here are still preliminary. Additional quality control is being performed on the data. Hansen et al. (2005) have suggested that lack of data may partly be responsible for the strong interdecadal variability observed in ocean heat content (and hence the thermosteric component of sea level change). Gregory et al. (2004) and manuscripts by other authors have examined time series of the data by 1° squares in the World Ocean Database (WOD) and reach similar conclusions. Here we present evidence that this variability is real. The figure below compares the yearly, global average SST anomaly based on the relatively sparse data set of WOD with the same quantity based on ICOADS and satellite SST measurements (constrained by SST observations from drifting buoys) from Smith and Reynolds (2004) (curve labeled “NCDC”). The correlation between the two series is 0.96. The reason for such good agreement between the two series is that the anomalies contributing to the global average are of large spatial scales (gyre & basin) and relatively long time scales (Levitus et al., 2005). Compositing and analyzing data by semester (6-month) and seasonal (3-month) still results in the same signal characterized by large interdecadal variability. Even relatively sparse sampling captures this signal. The objective analysis procedure used to generate the WODS based SST and heat content fields is basically a running spatial average of spatial scale 500 km, not data restricted to individual 1° squares. Despite this agreement, there is an additional need for more data. Temporal Variability of Thermosteric & Halosteric Components of Sea Level Change, 1955-2005 History of the Number of Temperature and Salinity Profiles Available Electronically from NODC Approximately 3 million of the 5.5 million increase in temperature profiles since the GODAR project began in 1993 are for the pre-1991 period. It is the “rescue” of these data that have allowed the first estimates of ocean heat content and steric sea level components to be made. Basin integrals of the thermosteric component of sea level change, 0-700m, 1955-2005 Atlantic Ocean Pacific Ocean Linear trends (mm/yr) (1955-1998) of zonally averaged steric sea level and its components The thermosteric & halosteric components of sea level change may compensate each other, or act in concert to affect sea level. Here, (Levitus et al., 2005) we document this for the zonally averaged linear trend of these components. Green line is the halosteric component of sea level; Dashed red line is the thermosteric component of sea level change based on all T data; Solid red line is the thermosteric component of sea level based on T obs. that have simultaneous measurement of salinity; Solid black line is the steric sea level [sum of halosteric and thermosteric (T-S simultaneous)]. Indian Ocean Indian Ocean World Ocean