Download
1 / 14
330 likes | 724 Views
Plotting Points on a Cartesian Plane. Plotting Points. Lesson Objective: Students will know how to plot points on a plane. Plotting Points. René Descartes (1596 – 1650) – Known for his saying “cogito ergo sum” “I think, therefore I am”

E N D
Plotting Points • Lesson Objective: Students will know how to plot points on a plane
Plotting Points • René Descartes (1596 – 1650) – Known for his saying “cogito ergo sum” • “I think, therefore I am” • Developed the Cartesian Plane system we use to plot points today. • Uses the x and y axis and 4 quadrants
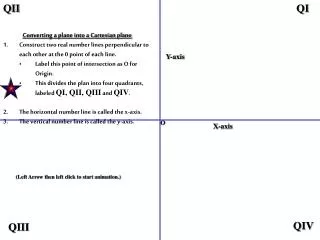
Plotting Points • The Cartesian Plane is mostly known as a “graph” • The graph has two axis • The vertical (up and down) is called the y-axis • The horizontal (left to right) is called the x-axis y x
Plotting Points • There are 4 quadrants to the graph • They work from the top right in a counter- clockwise fashion y II I x III IV
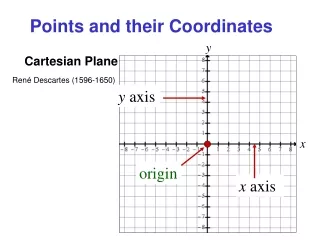
Plotting Points • The center of the graph where the two axis meet is call the • At this point, both the x and y values are zero y Origin x
Plotting Points • The lines on the graph represent one unit each • The x-axis works likes a linear graph where the origin is zero and the numbers on the right are positive, the numbers on the left are negative y x -4 -3 -2 -1 0 1 2 3 4
Plotting Points • The lines on the graph represent one unit each • The y-axis works likes the x-axis where the positive numbers go up and the negative numbers go down y 4 3 2 1 0 -1 -2 -3 -4 x
Plotting Points • When you plot a point, you use the values of x and y to determine where on the graph the point is. • A point always has the x value first, then the y y x x y ( , )
Plotting Points • To find point A, we have to find where it is on the x-axis first • Then we need to find the y value • So point A is known as (1, 3) y a 3 x 1 ( , ) 1 3
Plotting Points • Label point B y b x
Plotting Points • To find point B, we have to find where it is on the x-axis first • Then we need to find the y value • So point A is known as (-3, 2) y B 2 x -3 ( , ) -3 2
Plotting Points • Label points C, D, E, F, and G y f d You Try! c x e g
Plotting Points Quiz! • What is the vertical axis? • What is the horizontal axis? • What’s the point in the middle called? • What quadrant is point B in? • What quadrant is Point C • For 6 – 10, label the points A – E B A d e c