Download
1 / 30
300 likes | 461 Views
Calibration of the Cosmic Origins Spectrograph. James C. Green University of Colorado. The CU COS Instrument Team. Project Scientist: Cynthia Froning Instrument Scientist: Steve Osterman Steve Penton St é phane B é land Detector Scientist: Jason McPhate (Berkeley) Gone – but not forgotten

E N D
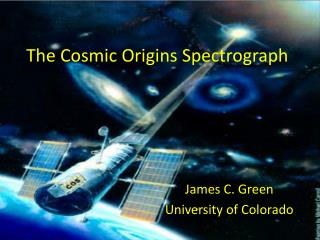
Calibration of the Cosmic Origins Spectrograph James C. Green University of Colorado
The CU COS Instrument Team Project Scientist: Cynthia Froning Instrument Scientist: Steve Osterman Steve Penton Stéphane Béland Detector Scientist: Jason McPhate (Berkeley) Gone – but not forgotten Erik Wilkinson Ken Brownsberger John Andrews Jon Morse Dennis Ebbets Dave Sahnow
NUV MAMA Detector (STIS spare) Calibration Platform OSM2: G185M, G225M, G285M, G230L, TA1 • COS has 2 channels to provide low and medium resolution UV spectroscopy • FUV: 1150-1775Å, NUV: 1700-3200Å • FUV gratings: G130M, G160M, G140L • NUV gratings: G185M, G225M, G285M, G230L • M gratings have spectral resolution of R ~ 20,000 FUV XDL Detector Aperture Mechanism: Primary Science Aperture, Bright Object Aperture OSM1: G130M, G160M, G140L, NCM1 Optical bench (not shown): re-use of GHRS bench
COS FUV Spectroscopic Modes Nominal Wavelength Resolving Power Grating Wavelength Range (R = l/Dl) b Coverage a per Exposure G130M 1150 - 1450 Å 300 Å 20,000 - 24,000 G160M 1405 - 1775 Å 375 Å 20,000 - 24,000 G140L 1230 - 2050 Å > 820 Å 2400 - 3500 a Nominal Wavelength Coverage is the expected usable spectral range delivered by each grating mode. The G140L grating disperses the 100 - 1100 Å region onto one FUV detector segment and 1230 - 2400 Å onto the other. The sensitivity to wavelengths longer than 2050 Å or shorter than 1150 Å will be very low. b The lower values of the Resolving Power shown are delivered at the shortest wavelengths covered, and the higher values at longer wavelengths. The resolution increases roughly linearly between the short and long wavelengths covered by each grating mode.
* N2 purge data through FUV detector door window. * Portion of FUV detector flat-field obtained during component-level testing.
COS NUV Spectroscopic Modes Nominal Wavelength Resolving Power Grating Wavelength Range (R = l/Dl) b Coverage a per Exposure G185M 1700 - 2100 Å 3 x 35 Å 16,000 - 20,000 G225M 2100 - 2500 Å 3 x 35 Å 20,000 - 24,000 G285M 2500 - 3200 Å 3 x 41 Å 20,000 - 24,000 G230L 1700 - 3200 Å (1 or 2) x 400 Å 1500 - 2800 a Nominal Wavelength Coverage is the expected usable spectral range delivered by each grating mode, in three non-contiguous strips for the medium-resolution modes. The G230L grating disperses the 1st-order spectrum between 1700 - 3200 Å along the middle strip on the NUV detector. G230L also disperses the 400 - 1400 Å region onto one of the outer spectral strips and the 3400 - 4400 Å region onto the other. The shorter wavelengths will be blocked by an order separation filter and the longer will have low thruput on the solar blind detector. The G230L 2nd-order spectrum between 1700 - 2200 Å will be detected along the long wavelength strip. b The lower values of the Resolving Power shown are delivered at the shortest wavelengths covered, and the higher values at longer wavelengths. The resolution increases roughly linearly between the short and long wavelengths covered by each grating mode.
Point source Spectra Calibration Stripes NCM3a NCM3a NCM3b NCM3c NCM3b NCM3c Increasing Wavelength 25.60 square 1.45 5.75 2.25 4.95 2.80 2.80 All dimensions in mm • NUV spectra projected onto the NUV MAMA detector
Wavelength Accuracy Extragalactic moderate resolution programs generally require absolute wavelength accuracy of ~ +/- 1 resel ( = +/- 15 km/s), with relative accuracy of 1/3 resel rms across the spectrum. Some programs that require higher accuracy can use “tricks” to obtain needed calibration - e.g., using known wavelengths of ISM lines along sight-line. • The aberrated HST PSF centered in the COS Primary Science Aperture. Target Acquisition • COS is a “slitless” spectrograph, so the precision of target acquisition (placement of target relative to calibration aperture) is the largest uncertainty for determining the absolute wavelength scale. • Goal is to center targets routinely in science apertures to a precision of • +/- 0.1 arcsec (= +/- 10 km/s). • Throughput is relatively insensitive to centering due to large size of science apertures; centering of +/- 0.3 arcsec necessary for >98% slit throughput.
Fundamental Design Priorities 1: Sensitivity 2: Bandpass 3: Spectral Resolution
High Sensitivity High throughput achieved through a minimum of reflections - ion etched blazed holographic gratings - windowless, opaque photocathode (NUV) COS throughput measured by direct comparison to RASCAL reference detector – effective areas calculated by multiplying by HST area and reflectivity
For Comparison - COS Throughputs:G130M @ 1216 Å (peak) = 19.7%, @1430 Å = 9.0%G160M @ 1430 Å = 11.7%, @1669 Å = 5.8%G140L @ 1248 Å = 10.7%, @1723 Å = 0.65%G185M @1777 Å = 3.9%, @2085 Å = 2.3%G225 M @ 2262 Å = 2.7%, @ 2497 Å = 2.8%G285M @ 2659 Å = 2.2%, @ 2998 = 1.0%G230L @ 1846 Å = 3.0%, @ 2998 Å = 0.8%
Spectral Resolution Spectral Resolution determined by measuring the FWHM of best Gaussian fit to emission lines: FWHM (m) * dispersion (Å/m) = / = Resolution This technique will underestimate the true resolution if the emission line is not monochromatic
COS has an imaging mode • TA1 : implemented for target acquisition and correction of initial installation errors • Broad Band Imaging in the NUV – no filters – response dictated by the MAMA QE curve
COS Imaging Plate scale = 0.024″ / pixel FWHM resolution (radial) 2.7 pixels = 0.064″ (FWHM is ~ 78% encircled energy) Field of View = 2.5″ - 3″ (fuzzy edge) (40 resol diameter - 105 pixel diameter image) For comparison, ACS WFC/HRC has 80/82% encircled energy in 0.25″
COS Flat Fielding • NUV MAMA – classic flat filed techniques yield high signal/noise capabilities
COS Flat Fielding • FUV detector show hex pattern consistent with MCP manufacturing process – • Stable geometric distortion map can be developed and applied • Classic flat field techniques do not fully remove the structure - redistribution
COS Bonus Feature Potential capability from 912 - 1150Å G140L places these wavelengths on the detector with spectral resolution of ~ 1000 Grating efficiency at 1048Å measured – implying 20-50 cm2 effective area at 1048Å – assuming that HST mirror coatings behave as grating coating