Download
1 / 16
160 likes | 277 Views
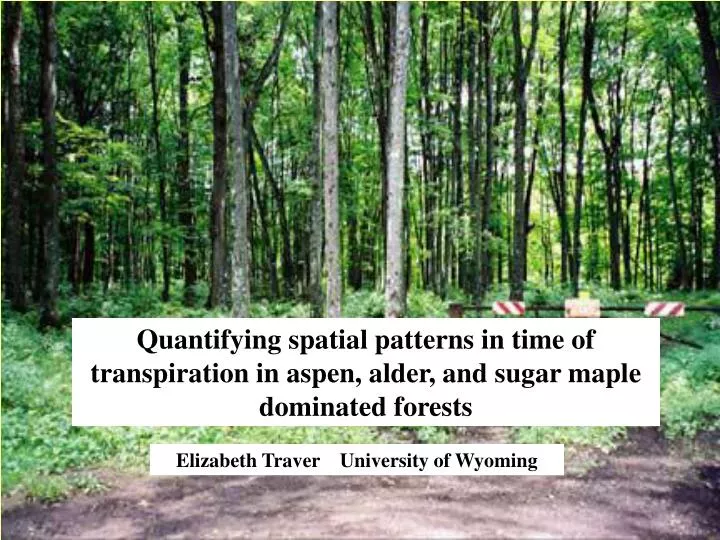
Quantifying spatial patterns in time of transpiration in aspen, alder, and sugar maple dominated forests. Elizabeth Traver University of Wyoming. Why spatial transpiration?.

E N D
Quantifying spatial patterns in time of transpiration in aspen, alder, and sugar maple dominated forests Elizabeth Traver University of Wyoming
Why spatial transpiration? • There is solid evidence that VPD is a major driver of transpiration in time, but it does not explain the variable spatial patterns within species. • Stands of trees tend to be more heterogeneous than homogeneous, with significant boundary areas--what causes these spatial patterns? • Finding the--possibly edaphic—causes of these spatial patterns, we can use that knowledge to scale up to larger, heterogeneous landscapes.
Hypotheses • VPD explains the temporal variability in spatial autocorrelation of transpiration. • At high VPD, edaphic conditions will explain the spatial autocorrelation of variability in transpiration total N impacts on root properties soil texture impacts on root cavitation
Sites • Aspen—Alder: SE of the WLEF tower • 120 m by 120 m with 144 plots in a 3/7 cyclic design • Runs from wetlands in NW to dry upland in SE • Sugar Maple—Red Pine: NW of the WLEF tower • 120 m by 120 m with 144 plots in a 3/7 cyclic design • Mostly sugar maple crossed by swath of red pine
Sugar Maple-Red Pine site Aspen-Alder site WLEF Tower
Methods • Measure sap flux spatially -- Granier: constant heat flux sensors • Measure or acquire environmental factors -- micrometeorology from WLEF tower: μ, Q, rh, temp • Measure soil characteristics within the 3/7 cyclic plots already established • Soil moisture curves • Soil texture • Total N • Intra-tree scaling -- Asap • Spatial sampling/analysis -- cyclic, ‘variograms, geostatistics, GIS
Nugget, sill, and range of transpiration plotted against VPD. As transpiration variation increases with VPD, spatial autocorrelation decreases. (Data from the aspen-alder stand.)
Future work Using what is already known about the temporal variability of transpiration, look at edaphic conditions to explain the spatial variability.