Download
1 / 21
210 likes | 287 Views
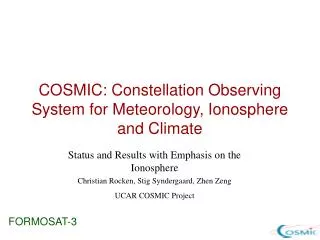
Commissioning Results of the D Ø Tracking System. Design Installation and Commissioning Tracking/Vertexing Results. Harald Fox Northwestern University May 24, 2002. Chicago . p. p. 1.96 TeV. Booster. p. CDF. DØ. Tevatron. p. p sou rce. Main Injector & Recycler.

E N D
Commissioning Results of the DØ Tracking System • Design • Installation and Commissioning • Tracking/Vertexing Results Harald Fox Northwestern University May 24, 2002
Chicago p p 1.96 TeV Booster p CDF DØ Tevatron p p source Main Injector & Recycler The Fermilab Tevatron Collider H. Fox
The DØ Detector Calorimeters Tracker Muon System protons Beamline Shielding 20 m Electronics antiprotons H. Fox
Tracker Design H. Fox
SMT Design 12 F Disks 4-layer barrel cross-section 4 H Disks 6 Barrels H. Fox
SMT Design • Require good 3D track reconstruction performance for high-pT (top, Higgs, EW, NP) and low-pT (B) tracks out to || < 3 • Momentum resolution less than 10% at pT = 1 GeV/c • Impact parameter resolution within 30 m • Forward H disks are employed to achieve these resolutions at high || H. Fox
Analog section Digital section Pipeline Control Logic Analog Pipeline: I/O To Silicon Detector Sparsification FIFO ADC Comparators 128 Integrators To Readout System 128 channel ADC ramp and counter 32 cells SMT Readout Electronics • SVX IIe Chip • 128 channel, 32 pipeline cells • 8 bit ADC with sparsification • 106 MHz digitization, 53 MHz readout • Radiation hard • Developed by LBL/Fermilab group • Interface Boards • Refresh signals and adjust timing • Power management and monitoring • SEQencers • Management of SVX • Conversion to fiber optics • VRB (VME Readout Buffer) • Data buffer pending L2 trigger decision • ~ 50 Mb/s/channel • 5-10 kHz L1 accept • 1 kHz L2 accept rate H. Fox
8 layers of axial and 3° stereo fibers mounted on carbon fiber support cylinders. 20cm < r < 51cm. 76,800 individual fibers. Diameter: 835μm. Length: 1.8/2.6m. The interlocked fibers are precisely positioned. Hit resolution about 100μm. CFT Design H. Fox
~8-11m long wave-guides to Visible Light Photon Counter (VLPC, solid state photo multiplier). VLPCs are operated at 9K. Quantum efficiency: 80%. 1 mip ~ 8 photo electrons: Excellent S/N! LED Calibration 0 pe 1 pe 2 pe 3 pe 4 pe CFT Readout Electronics • High gain: 17k – 65k e per photon • AFE boards provide • Bias voltage • Temperature control • Fast digital trigger information • Analog pulse information (SVX) • SEQ + VRB readout as SMT H. Fox
Installation SMT cylinder • Fiber tracker installation • Cylinder installation was completed on 12/20/00 • A ½ cylinder of 3 barrels and 6 F disks was inserted into each end of the CFT bore • H Disk installation was completed on 2/6/01 • The cabling (~15,000 connections) and electronics installation was completed in May 2001 • Axial Fiber Tracker electronics installed in November 2001 • Stereo electronics completed April 2002 Interface Boards High Mass Cables Low Mass Cables SMT Calorimeter Cryostat with AFE boards Wave guides H. Fox
n-side pulse-height (ADC) p-side pulse-height (ADC) p-side pulse-height (ADC) fraction of 1 strip clusters Local track incidence angle SMT Charge Collection Charge correlation between p- and n-side of a detector • Cluster charge (corrected for track angle): 1 mip ~ 25 ADC counts. Noise < 2ADC counts. φL =4.5° Lorentz angle: The charge deflection due to the magnetic field H. Fox
CFT Commissioning Zee candidate event. Mass 89.9GeV/c2 Light yield per sector vs pseudorapidity η H. Fox
CFT track SMT track y track x Tracking and Vertexing CFT-SMT track matching Impact parameter resolution Vertex measurements DCA H. Fox
Wen candidates ET(cluster)/pT(track) Physics Results E/p for Weν candidates Z μ+μ- cand. KS π+π- cand. J/Ψ μ+μ- candidates First evidence for B decays H. Fox
Conclusions • Design • The DØ tracking detectors are designed to have a good impact parameter resolution over a wide range of η. • Commissioning • The SMT was the first major DØ Upgrade detector system fully operational for Run 2A. • About 95% of the channels are available for readout. • Results • Calibration, beam measurement, and alignment results are looking promising. • Physics results coming in. • Noise studies, tracking refinements, etc. continue. H. Fox
The DØ Collaboration The work of many people...…thanks to all of them. H. Fox
Lorentz angle • Lorentz angle is different for p- and n-sides • Lorentz shift is not visible for 90 deg stereo strips • Lorentz shift is large for 2 deg stereo • Lorentz angle can be measured in local phi distribution for one strip clusters • Measurement is NOT affected by alignment or reconstruction P-side (axial) Phi distribution for one strip clusters h+ e- Data p-side H. Fox
SMT Design: Stereo Angles • Ladders • 3-chip: 72 single-sided, axial ladders in the two outer barrels • 6-chip: 144 double-sided, axial/90° ladders in the four inner barrels • 9-chip: 216 double-sided, axial/2° ladders in all barrels • Wedges • F Disks: 144 double-sided, ±15°, 6+8 chip wedges • H Disks: 96×2 back-to-back single-sided, ±7.5°, 6 chip wedges 9-chip ladder H wedge H. Fox
Production & Assembly: Testing • Probe Test • Debug bad strips (broken capacitors), bonds, chips, etc. • Determine the V-I characteristics of the sensors • Measure V-max p-side breakdown voltage (micro-discharge effect) • Burn-in • Bias the ladder or wedge and test the readout for 72 hours • Measure pedestals, noise, gain and check sparse readout • Laser • Expose biased detectors to a narrow laser scan • Measure the depletion voltage and leakage currents and identify dead channels • Readout tested again after the detector has been mounted. V-max Fail H. Fox
SMT Readout: Data Flow HV / LV I,V,T Monitoring 8’ Low Mass Cable ~19’-30’ High Mass Cable (3M/80 conductor) 25’ High Mass Cable (3M/50 conductor) 3/6/8/9 Chip HDI KSU Interface Board CLKs CLKs Adapter Card SEQ SEQ SEQ Sensor SEQ Controller Optical Link 1Gb/s Detector volume Platform Serial Command Link VRB VRB VRB VBD 68k/PwrPC 1 5 5 3 VRB Controller Bit3 VME PC MPM L3 Counting House SDAQ H. Fox
Alignment: Residuals • SMT-only tracking with at least 4 hits • Magnet off data • Similarity of residuals from reconstruction with ideal and survey geometries indicates excellent internal alignment of the SMT Ideal Geometry Survey Geometry H. Fox