Download
1 / 6
60 likes | 198 Views
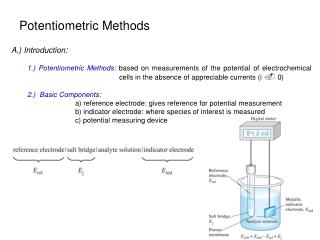
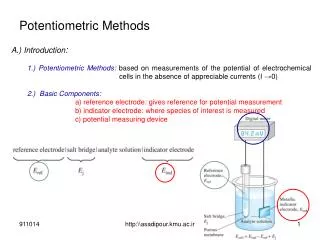
Albumin Analysis by Potentiometric Method. Table : The relationship of peak current and albumin concentration. Fig 2. The cyclic voltammogram of the selectivity

E N D
Table : The relationship of peak current and albumin concentration
Fig 2. The cyclic voltammogram of the selectivity WE:Au wire, WE area: 0.0113 cm2, RE: Ag/AgCl(0.5M), CE: Pt, Electrolyte: 0.5 M KCl 50 ml(20 mM K4Fe(CN)6+20 mM K3Fe(CN)6), Potentiostat: CHI-405, Scan range: -0.2~0.6 V, scan rate: 0.05 V/sec
Table Ⅱ: The relationship of peak current and albumin concentration
Fig 3. The cyclic voltammogram of Au wire electrode WE: Au wire, WE area: 0.0113 cm2, RE: Ag/AgCl(0.5M), CE: Pt, Electrolyte: 0.5 M KCl 50 ml(20 mM K4Fe(CN)6+20 mM K3Fe(CN)6), Potentiostat: EG&G, Scan range: -0.2~0.6 V, scan rate: 0.02 V/sec,albumin 在電解液中加入
Table Ⅲ: The relationship of peak current and albumin concentration