Download
1 / 66
670 likes | 759 Views
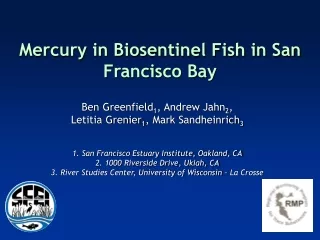
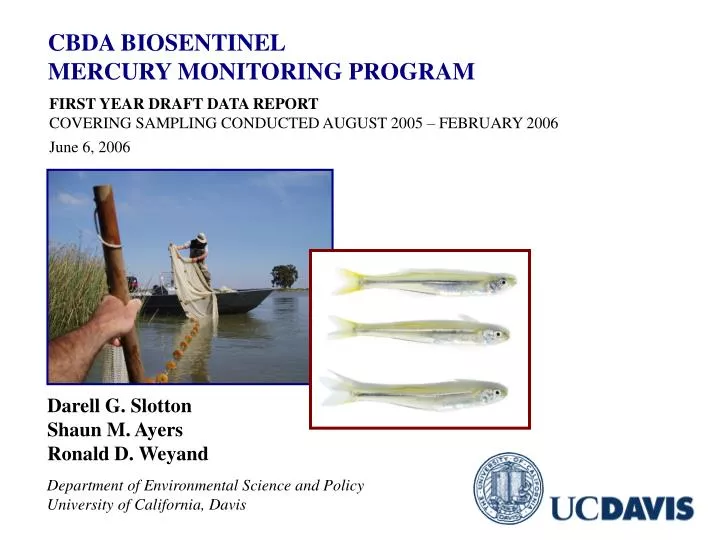
CBDA BIOSENTINEL MERCURY MONITORING PROGRAM. FIRST YEAR DRAFT DATA REPORT COVERING SAMPLING CONDUCTED AUGUST 2005 – FEBRUARY 2006 June 6, 2006. Darell G. Slotton Shaun M. Ayers Ronald D. Weyand. Department of Environmental Science and Policy University of California, Davis.

E N D
CBDA BIOSENTINEL MERCURY MONITORING PROGRAM FIRST YEAR DRAFT DATA REPORT COVERING SAMPLING CONDUCTED AUGUST 2005 – FEBRUARY 2006 June 6, 2006 Darell G. Slotton Shaun M. Ayers Ronald D. Weyand Department of Environmental Science and Policy University of California, Davis
Introduction to biosentinel sampling, species used, compositing vs individuals issues. Presentation of site distribution, rationale Presentation of fall 2005 spatial mercury data Presentation of new seasonal mercury data Consideration of 2006 sampling plans Biosentinel Morning Session: Presentation Overview
Why Biosentinels? Biosentinel Mercury Monitoring Using small, young fish as localized, time-sensitive measures of methylmercury exposure • Interannual trends and variability • Within-year seasonal trends • Spatial patterns on a fine scale
Fall 1999 UC Davis Inland Silverside Regional Spatial Recon.
Biosentinel Program Goals and Objectives • Develop baseline data and ongoing performance data at major restoration and remediation sites. • Track inter-annual trends at a set of index sites and restoration sites • Seasonal trends and inter-species relationships at intensive sites. • Help define conditions leading to greater or lesser levels of methylmercury exposure. • Link to process studies, large fish monitoring, and wildlife issues.
Do restorations and particular habitat types alter methylmercury exposure and bioaccumulation patterns, locally and/or regionally? Are there underlying regional patterns of methylmercury exposure across the system? What is the range of natural interannual variation in relation to potential restoration-related changes we are monitoring? Does methylmercury exposure and bioaccumulation exhibit significant within-year seasonality? Do annual winter flood inputs play a significant role in Bay-Delta methylmercury exposure and bioaccumulation? Do restorations effect methylmercury exposure differently in different parts of the system? Hypotheses / Questions:
Project Linkages Other Sport Fish Monitoring Feedback on: Management, Restoration, Remediation Sport Fish Com- ponents Biosentinel Components Wildlife Other Mercury Science Projects Advisory Development Outreach & Education
Requirements for Ideal Biosentinels • Relatively short-lived and non-migratory. • Widespread across study area. • Important component of local food web. • Linkage to aqueous methylmercury exposure. • Linkage to sport fish and wildlife. • Bioaccumulate methylmercury at high enough concentrations to differentiate subtle variability. • Exhibit consistent mercury bioaccumulation across a useful and defined size range. • Feasible to collect with sufficient replication to provide strong statistical measures of variability.
Central Project Area Primary Species: Inland Silverside (Menidia beryllina)
Primary Species in Salmon Restoration Areas: Prickly Sculpin (Cottus asper) • Merced River • Tuolumne River • Clear Creek
Main Secondary Species Across Central Region Threadfin Shad (Dorosoma petenense) Grass Shrimp (Crangon sp.) Largemouth Bass (juv) (Micropterus salmoides) Bluegill Sunfish (juv) (Lepomis macrochirus)
Biosentinel Sampling Techniques Backpack electroshocking Seining Boat-assisted seining Tow seining
Biosentinel Sampling Techniques Boat electroshocking Field freezing on dry ice Field cleaning, sorting, packing
Compositing Considerations (n = 15) (n = 25) (n = 5) Multi-Individual Comps Multiple Composites Multiple Individual Analyses 0.32 ppm ±0.02 0.30 ppm MeHg 0.28 ppm ±0.08 0.30 ppm ±0.04 0.31 ppm ±0.02
Concentration Separations and 95% Confidence Intervals (means of 2 sample sets) C.I. overlap = not statistically different at 95% confidence level 100 ng/g THg 125 ng/g THg
Concentration Separations and 95% Confidence Intervals (means of 2 sample sets) C.I. separation = statistically different at 95% confidence level 100 ng/g THg 125 ng/g THg
Power Analyses to Estimate Appropriate Numbers of Individual Analyses per Sample Set to Statistically Differentiate a 25% Difference Between Mean Values b) Standard analysis of statistical “Power” vs n, CV n = 30: optimal sample size for this project
Multiple Individual Fish Analyses Ideally: consistent over size range, distinctive from other sites and times Mean Hg ± 95% C.I.
Distinguish spatially distinct populations and exposure levels at adjacent sites: Inland Silversides (vs previous slide)
Distinguish spatially distinct populations and exposure levels at adjacent sites: Prickly Sculpin (vs next slide)
Distinguish spatially distinct populations and exposure levels at adjacent sites: Prickly Sculpin (vs previous slide)
“Shotgun” scatter patterns may indicate mixing of individuals from varying exposure areas or microhabitats
Size:Hg relationships apparent in individual data: Largemouth Bass
Declining Hg trend with size may indicate increasing recent exposure: Largemouth Bass
Issues With Composites • Limited ability to detect outliers, scatter • Limited ability to detect split populations • Limited ability to detect potential size:Hg trends • Individuals not equally represented Largest individuals in sets to 3+ times larger than smallest; 3+ times more weighting; less than expected replication
Entire Biosentinel Monitoring Region Clear Creek Salmon-based restorations with historic dredge tailings (Clear Creek, Merced and Tuolumne Rivers) Ham- ilton City Sacra- mento River Cache Creek Tuolumne San Joaquin River Merced Mud, Salt Sloughs, Upstream San Joaquin
Entire Biosentinel Monitoring Region Clear Creek Hamilton City area Ham- ilton City Sacra- mento River Sacramento River below zone of planned CBDA wetlands restoration Cache Creek Mud Slough Tuolumne San Joaquin River Merced Documented source of elevated methyl Hg; draining Kesterson and south valley wetlands Mud, Salt Sloughs, Upstream San Joaquin
Central Region With Most Restorations Intensive Sites Yolo Bypass and North Delta Index Sites Restoration Sites Sacramento RM44 McCormack Williamson Tract Napa Marsh Suisun Marsh Cosumnes River Prospect Slough Sac. Riv. Rio Linda SJ Pot. Slough Frank’s Tract Petaluma River Grizzly San Pablo Bay Honker Bay Suisun Bay SW Sherman Island Dutch Slough Middle River San Joaquin Vernalis
Starting with tributary, salmon-based restorations (sculpin sites) Specific Restoration Regions, With Data:
Clear Creek Region (TetraTech graphic) Sacramento River Restoration Areas Dredge Tailings Clear Creek
Tuolumne and Merced Rivers Dredge Tailings Tuolumne River San Joaquin River Merced River
Tuolumne and Merced Rivers Prickly Sculpin Mercury Trend, Late Summer 2005 Dredge Tailings Tuolumne River San Joaquin River Merced River • Merced higher than Tuolumne • Below tailings not statistically elevated • Merced data similar to 2003 study
Prickly Sculpin Regional Mercury Merced River Sac R. RM44 Clear Creek Tuolumne River Sac R. Hamilton City
Cache Creek at Rumsey (pre-remediation) Smallmouth Bass Speckled Dace Hitch Pike- minnow • Distinct year classes (speckled dace) • Consistent first year fish • Consistent Hg in most young fish
Into the silverside zone… Specific Restoration Regions, With Data:
Yolo Bypass and North Delta Sites Yolo Bypass Wildlife Area Toe Drain Passive tidal gate at Lisbon North marsh areas Little Holland Tract Liberty Island Prospect Slough Index
Yolo Bypass and North Delta Inland Silverside Mercury Trend, Fall 2005 • Very high levels in Bypass ponds: (147-169 ng/g Hg, means) • Elevated in adjacent Toe Drain (both sites) but 50% lower • 68% lower by Prospect Slough • Mercury in marsh portions of North Delta flooded tracts lower
Yolo Bypass and North Delta Silverside Fall 2005 Mercury Trend Bypass Ponds Toe Drain At YBWA Prospect Slough Index Liberty Island Little Holland Sac RM44 Index Flats Marsh
Suisun Marsh Region (from 2004 Suisun Marsh Bay-Delta Consortium, 2004) Back Spring Branch Suisun Slough Montezuma Slough
Suisun Marsh Inland Silverside Mercury Trend, Fall 2005 Back Spring Branch Suisun Slough • Montezuma inflow site same as Sherman, etc. • Natural site (Back Spring Br.) same as N Suisun Sl. • Apparent declines across both main sloughs (at this time) Montezuma Slough
Suisun Marsh Region: Inland Silverside Fall 2005 Mercury Trend Montezuma Slough Grizzly Index Back Spring Branch Suisun Slough N Suisun Bay SW Index E Suisun Slough S W
Napa Marsh and Petaluma River Region Mid China Slough • Extensive area of former salt ponds American Canyon CBDA Wetlands Peta- luma River Napa River San Pablo Bay
Napa Marsh and Petaluma River Silverside Mercury Trend, Fall 2005 • Highest Napa Region Hg above restorations at Napa and outside at San Pablo Bay • Vegetated Pond 2A: lowest Hg • Petaluma sites elevated
Napa and Petaluma Marsh Region: Silverside Fall 2005 Mercury Trend Napa River and Marsh Sites Peta- luma River San Pablo Bay Index Napa R. At Napa Mid China Slough Pond 2A (veg) Am. Cyn
Location of the Dutch Slough Restoration (from Dutch Sl Rest. web site) Mt. Diablo Hg Mine; (upstream, Marsh Ck) Marsh Creek • Among lowest silversides concentrations in entire watershed; statistically lower at Marsh Creek site • No silversides in Emerson Slough, but good collections of bass and bluegill; bass lowest again at Marsh Creek site.
McCormack-Williamson Tract and Cosumnes River Mc-Cormack Williamson Tract (planned) Cosumnes River Sacramento River • Cosumnes R. one of highest silverside Hg spots in project Mokelumne River • Silversides not collectible at M-W, but good collections of juvenile bass and bluegill
Vernalis Index Mud Slough Region, Southern San Joaquin San Joaquin River Mud Slough Upper San Joaquin Mud Slough Kesterson and other wildlife refuges, wetlands Salt Sl
Vernalis Index Mud Slough Region, Southern San Joaquin Silverside Hg Spatial Trend. Fall 2005 • Mud Slough highly elevated • Salt Sl elevated less, variable San Joaquin River • Silverside Hg attenuated by Vernalis Upper San Joaquin Mud Slough Salt Sl Kesterson and other wildlife refuges, wetlands