Download
1 / 43
430 likes | 579 Views
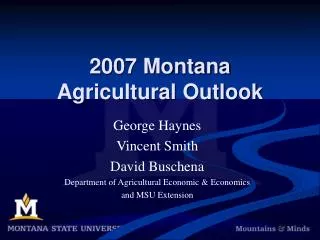
2013 Agricultural Commodity Outlook. Iowa Chapter of ASFMRA Annual Meeting Ames, Iowa Feb. 7, 2013 Chad Hart Associate Professor/Grain Markets Specialist chart@iastate.edu 515-294-9911. Cattle Crush Margin. The Crush Margin is the return after the feeder steer and corn costs.

E N D
2013 Agricultural Commodity Outlook Iowa Chapter of ASFMRA Annual Meeting Ames, Iowa Feb. 7, 2013 Chad Hart Associate Professor/Grain Markets Specialist chart@iastate.edu 515-294-9911
Cattle Crush Margin The Crush Margin is the return after the feeder steer and corn costs. Live weight: 1250 pounds Feeder weight: 750 pounds Corn: 50 bushels per head Source: ISU Extension
Hog Crush Margin The Crush Margin is the return after the pig, corn and soybean meal costs. Carcass weight: 200 pounds Pig price: 50% of 5 mth out lean hog futures Corn: 10 bushels per pig Soybean meal: 150 pounds per pig Source: ISU Extension
U.S. Meat Production & Prices Source: USDA-WAOB
U.S. Corn Supply and Use Source: USDA-WAOB
U.S. Soybean Supply and Use Source: USDA-WAOB
Projected Corn Yields Top: 2012 Yield Bottom: Change from 2011 Units: Bushels/acre
Projected Soybean Yields Top: 2012 Yield Bottom: Change from 2011 Units: Bushels/acre
World Corn Production Source: USDA-WAOB
World Soybean Production Source: USDA-WAOB
World Weather Source: USDC and USDA
Corn Export Shifts Source: USDA-FAS
Soy Export Shifts Source: USDA-FAS
U.S. Blended Gasoline Consumption 7.6 bil. gal. 7.4 bil. gal. Source: DOE-EIA, via USDA-ERS
Current Corn Futures 6.78 5.57 5.37 Source: CME Group, 2/5/2013
Current Soybean Futures 14.18 12.82 12.44 Source: CME Group, 2/5/2013
Total Acreage Shift Source: USDA-NASS
Acreage Shift by Crop Acreage change from 2011 Units: 1,000 acres Source: USDA-NASS
Acreage Shift by State Top: Planted in 2012 Bottom: Change from 2011 Units: 1,000 acres Source: USDA-NASS
Thoughts for 2013 and Beyond • Supply/demand concerns • Soil moisture issues • Biofuel and export strength • Worldwide response to drought-induced pricing • Risk management • Crop insurance • Price protection
Thank you for your time!Any questions?My web site:http://www.econ.iastate.edu/~chart/Iowa Farm Outlook:http://www.econ.iastate.edu/ifo/Ag Decision Maker:http://www.extension.iastate.edu/agdm/