Download
1 / 33
330 likes | 490 Views
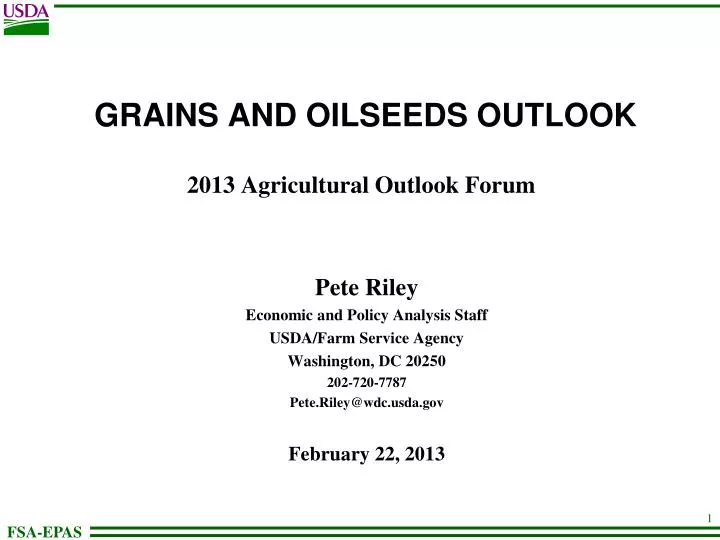
GRAINS AND OILSEEDS OUTLOOK 2013 Agricultural Outlook Forum. Pete Riley Economic and Policy Analysis Staff USDA/Farm Service Agency Washington, DC 20250 202-720-7787 Pete.Riley@wdc.usda.gov February 22, 2013. Today’s Presentation. Acreage, including CRP Update Yields and Production

E N D
GRAINS AND OILSEEDS OUTLOOK2013 Agricultural Outlook Forum Pete Riley Economic and Policy Analysis Staff USDA/Farm Service Agency Washington, DC 20250 202-720-7787 Pete.Riley@wdc.usda.gov February 22, 2013
Today’s Presentation • Acreage, including CRP Update • Yields and Production • Highlights of Supply and Demand Balance Sheets • Corn and Soybean Yield Scenarios Under Alternative Weather Assumptions
2012 Principal Crop Plantings were 326.3 million Acres, the Highest Since 2002 • Year to year increase was 11.2 million acres, the largest since 1996. • Very strong price incentives and favorable (dry) planting conditions account for the large gain. • Acreage for every principal crop except cotton showed an increase over 2011. • Principal crops include all major field crops, hay, minor oilseeds, potatoes, dry beans, tobacco, sugarcane and beets, peas and lentils, millet, and rye.
Since 2008, Corn and Soybeans Have Accounted for More than Half of Principal Acres
Losing Acreage: Wheat and Hay Trending Down * Records date from 1909.
Conservation Reserve Program (CRP) Acres Are Declining • CRP conserves soil, water, and wildlife resources by taking environmentally sensitive land out of crop production, under 10-15 year contracts. • Land is planted to long-term, conserving covers, mainly grass and trees. • Current total enrolled is 27.1 million acres, down 9.7 million from 2007 peak. • 2008 Farm Bill lowered cap on acres from 39.2 million to 32.0 million.
What Land Left the CRP in 2012?6.5 million acres expired, but about 3.4 million was reenrolled and some new acres were also enrolled Will the land be cropped in 2013? Some will go into corn and soybeans, given high prices, but little would be considered prime land. While most CRP acres were in grass, the land still needs preparation before crops can be planted. Traditionally, a large share has stayed in grass immediately after CRP, reflecting both its location, and time and costs to prepare for crops. Net expired acres available for 2013 cropping total nearly 2.5 million.
2013 Acreage Projections: Slight Decline in Corn, Small Gains in Soybeans and Wheat Another year of large plantings supported by strong new-crop prices: • Corn down slightly from last year’s 75-year high on more normal spring planting weather. • Despite favorable price incentives, HRW area down due to drought. SRW acres are up, while spring wheat expected to decline. • Soybeans increase with attractive prices relative to year ago and relative to corn, more double cropping potential, and decline in cotton acres. Million acres
Corn and Soybean Yields and Production to Rebound with Normal Weather • Wheat yield (based on trend) down from 2012 record. • Harvested HRW acres to fall on poor weather . • Wheat crop projected 7 percent lower. • Soybean production projected to rise 13 percent as yield recovers from drought.* • Corn production projected to jump 35 percent as yield recovers by 40 bushels per acre.* *Corn and soybean yields based on weather model.
Wheat Supplies to Fall on Lower Beginning Stocks and Smaller Crop • Wheat supplies projected to fall 7 percent, lowest since 2007/08. • Beginning stocks for 2013/14 expected to slip under 700 million bushels for the first time in 4 years. • 2013 production of 2.1 billion bushels would be just under the previous 3-year average.
Wheat Exports Expected to Decline as Competitor Production Rebounds • While U.S. supply falls, most competing exporters are projected to have larger crops, led by the Black Sea region and the EU. • There will be good opportunities for U.S. exports in the first half of the marketing year, as new-crop winter wheat is harvested before the main competitor crops. • However, the longer term downtrend in U.S. export market share is expected to continue.
Wheat Ending Stocks Projected to Decline But Outlook is Far from Tight • Stocks are projected at 639 million bushels, the lowest since 2007/08. • Total use projected to slide 7 percent from 2012/13, with declines in exports and domestic use. • The ratio of stocks-to-use is projected at 28 percent, down just marginally from the 28.2 percent forecast for 2012/13.
Soybean Supply Expected to be the Highest in 7 Years • Despite very low beginning stocks, bigger crop will raise supply 11 percent and would be the second highest ever. • 2013 production projected to slightly eclipse prior record high of 2009.
Soybean Crush Projected to Increase 3 Percent • 2013/14 crush rebounds from 9- year low. • Soybean meal feeding to increase modestly on lower prices and some expansion in poultry and pork. • Despite increased crush, soybean oil supplies are projected to decline for the fourth straight year--to the lowest since 2004/05--on very low carryin stocks.
Soybean Exports to Grow on Continued Strong Import Demand by China • U.S. exports projected up 12 percent, matching previous record highs. • China’s growth driven by strong demand for veg. oil for food and improved feed rations using more protein meal. • Despite supply gains and lower prices, export competition will remain intense as South American production rebounds from last year’s poor crops.
Soybean Ending Stocks Projected to Double in 2013/14 • Soybean ending stocks are projected at 250 million bushels, double the level forecast for 2012/13, and the highest since 2006/07. • The stocks-to-use ratio would rise to 7.6 percent, compared with the historically low level of 4.1 percent forecast for 2012/13.
2013 Corn Supply Expected to be Record Large • Despite the lowest forecast carryin stocks since 1995/96, corn supply projected up 28 percent to 15.2 billion bushels. • Although planted area is expected to fall slightly, harvested area is expected to be the highest since 1933. • Area of corn cut for silage or abandoned will decrease with better growing conditions.
Feed and Residual Use to Increase in 2013/14On Larger Corn Supply and Lower Prices • Feeding to increase with lower feed costs and growth in poultry and pork production. • Sharp increase in residual disappearance with huge increase in the crop. • Beef sector prospects hampered by drought impacts and tighter cattle supplies. • Any recovery in forage supplies will also influence grain feeding. • Small expansion in feeding of distillers’ grains expected with more ethanol production.
Only Modest Rebound in Ethanol in 2013/14Reflects Decline in Gasoline Use and “Blend Wall” • Potential market for ethanol constrained by declining gasoline consumption. • The “blend wall” refers to a market saturated at the 10-percent blend (E10). • Ethanol exports are not expected to recover to 2011 highs, with higher production in Brazil and EU trade barriers. • Imports of sugarcane ethanol from Brazil are increasing. • No significant expansion expected for E15 or E85.
What Accounts for Declining Gasoline Consumption? Fewer Miles Driven Efficiency Gains Virtually all new vehicles get more miles per gallon. For example, the Ford 150 series pick up (the top selling vehicle over the last decade), gets 18 mpg for 2013, up from 16 in 2003, a 12.5 percent improvement.* *Example of 6-cylinder automatic • Vehicle miles driven peaked in 2007. • Recession explains initial decline, but there are other factors: - High gasoline prices. - Aging baby boomers. - Teenagers delaying driving. - Population shifts to urban areas.
Corn Export Recovery Limited As Competition Remains Strong • Exports for the current 2012/13 year are forecast at just 900 million bushels, the lowest since 1971/72. • U.S. shipments are projected to rise, but stay relatively low at 1,500 million bushels. • The recent downtrend reflects very high U.S. prices and loss of market share, as farmers worldwide have responded to high price signals.
High Prices Trigger Sharp Increase in Corn Exports by Non-Traditional Exporters • Record high corn prices have triggered a strong production response in the rest of the world. • Foreign export gains have been led by Brazil and Ukraine. • Much of Brazil’s gains reflect winter corn production that does not directly compete with soybeans. • Some countries normally not competitive due to high prices and/or quality concerns have stepped up shipments.
U.S. Market Share Plummets While Global Corn Trade is Near Record High
Corn Ending Stocks to Build as Supply Gain Outpaces Increase in Use • Stocks projected to more than triple from 2012/13, to nearly 2.2 billion bushels, slightly higher than 1992/93 and 2004/05. • Total use is projected at 13 billion bushels, up 16 percent from sharply curtailed use in 2012/13, but still slightly below record use of earlier years. • Stocks build as sharp export competition, the plateau in ethanol, and the declining cattle herd limit a full rebound in use.
2013 Prices Will Decline with Record Corn Supply and Increase in Soybean Crop • Wheat price decline moderated by large share marketed during the summer months when corn prices will still be high. • The soybean price expected to be the lowest since 2009/10, under heavy pressure from the corn market. • Corn prices expected to fall sharply from the 2012/13 record, given the dramatic production increase. • While harvest-time cash corn prices could fall toward $4.00, some forward sales will support the farm price at a higher level. Prices received by farmers $ per bushel
Risks Around the Forecasts • Uncertain transition from the very tight old crop situation: • South American crop production. • Brazil export logistics. • Degree and duration of the new crop risk premium. • Timing/availability of new-crop supplies. • Actual planted acreage for 2013. • Volatility in oil and energy markets. • Foreign producers’ response to falling prices. • China: • Will it continue to increase soybean buying? • Will China ramp up corn imports as prices become more attractive? • Weather.
Yield Scenarios From Weather ModelsAssume Plus or Minus One Standard Deviation* for Rainfall and Temperature in Most Critical Growing Period Corn Soybeans * Standard deviation = 0.72 in. (rain), 2.0 degrees (temp) * Standard deviation = 1.21in. (rain), 2.5 degrees (temp).
Corn Yield Scenarios Supply • Low yield production of 13.6 billion bu. would still beat 2009 record high of 13.1 billion bu. by 500 million. • High yield case pushes production to 15.1 billion bu., 2 billion bu. higher than the old record. Utilization • Most response seen in feed and residual in either case. • In the low case, there would also be little or no pasture recovery. • Ethanol expansion constrained by blend wall. • Export potential similarly constrained by large foreign supplies. Ending Stocks and Price • Big stocks increase even in low yield scenario will push price down sharply.
Soybean Yield Scenarios Supply • Low yield production of 3.3 billion bu. would still result in a year to year increase of 270 million bu. • The high yield scenario would increase the potential record size of the crop by 90 million bu. from the trend yield. Utilization • Strong domestic demand for protein limits adjustment in crush. • Crush also supported by mandated biodiesel use. • Export effects muffled by strong demand by China. Ending Stocks and Price • Impact is modest in both cases, with much of the price effect driven by corn.