Download
1 / 19
220 likes | 358 Views
Forecasting CPI. Xiang Huang , Wenjie Huang, Teng Wang , Hong Wang Benjamin Wright , Naiwen Chang, Jake Stamper. Definition. The consumer price index (CPI) measures the cost of a standard basket of goods and services commonly purchased by households.

E N D
Forecasting CPI Xiang Huang , Wenjie Huang, Teng Wang , Hong WangBenjamin Wright , Naiwen Chang, Jake Stamper
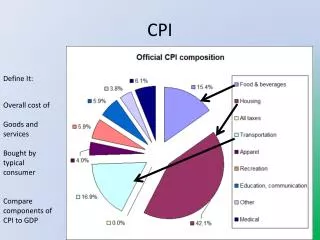
Definition The consumer price index (CPI) measures the cost of a standard basket of goods and services commonly purchased by households. The index is published monthly by the Bureau of Labor Statistics, and is used to calculate the rate of inflation.
CPI index since 1983 Trace Histogram
Correlogram of CPI Evidence of an evolutionary series. Use first-differencing to pre-whiten and obtain a stationary series.
First-Difference of CPI Trace Histogram
Correlogram of DCPI Add AR(1),AR(2),and MA(12)
UnitRoot of DCPI Augmented Dickey-Fuller is sufficiently negative, rejecting the presence of a unit root.
ARIMA MODEL OF DCPI Cycle Calculation: Tan theta=0.36/0.28=1.2857 Theta=52.125 degree Cycle=360/52.125=6.9 years
ARIMA MODEL OF DCPI Actual, Fitted and Residuals Graph Histogram of Residuals
Correlogram of Residuals Breusch-Godfrey Serial Correlation Test
Add ARCH(1) Correlogram of Square Residuals
Correlogram Add ARCH(1) and GARCH(1) in ARIMA model
Drop AR(2) Trace of the standardized residuals
Correlogram of Standardized Squared Residuals Histogram of Standardized Squared Residuals
Attempt to Create Distributed Lag Model No Granger Causality for Relevant Variables • GDP • Unemployment Rate • Capacity Utilization • Industrial Production • Manufacturing Production • Commercial and Industrial Loans • Consumer Loans • Consumer Sentiment • Money Supply (M2) • Federal Funds Rate Without Granger Causality, no distributed lag model could be crated
True value CPI in April 2011: 224.43 True value CPI in April 2011: 224.43 Comparison of Different Models Actual Value of CPI in April 2011: 224.43