Download
1 / 25
250 likes | 378 Views
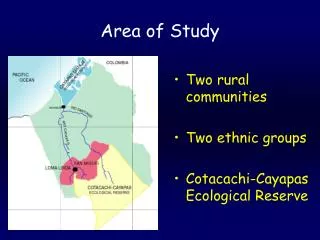
Overview of the Fair Park Area Neighborhood Study. Jim Murdoch University of Texas at Dallas December 11, 2012. Neighborhood Studies. Place-based The geographic boundaries do not change Longitudinal The study is conducted over several years Interdisciplinary Land use, well-being, change

E N D
Overview of the Fair Park Area Neighborhood Study Jim Murdoch University of Texas at Dallas December 11, 2012
Neighborhood Studies • Place-based • The geographic boundaries do not change • Longitudinal • The study is conducted over several years • Interdisciplinary • Land use, well-being, change • Trying to understand “Neighborhood Effects” • Project on Human Development in Chicago Neighborhoods • Multiple neighborhoods • Focus on social processes • Fair Park Area Neighborhood Study • One neighborhood • Focus on longitudinal change driven by economic development
Neighborhood Effects • “I like the apartment but not the neighborhood” • “This location is really convenient” • “I hate to move Mom because she has so many friends that live close to her” • “Don’t play in that park” • “His neighborhood friends are a bad influence” • “We meet at the end of the street and walk every morning” • “Let’s walk home from school together”
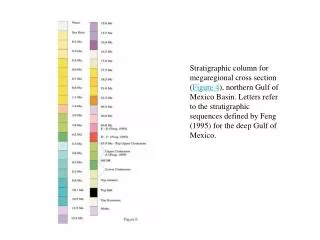
Census Data: 2000 versus 2010 Note: Census geographies do not correspond exactly to the study area.
Census Data 2000 versus 2010 Note: Census geographies do not correspond exactly to the study area.
DISD Data: Fall 2007 versus Fall 2012 FP Area had 4,706 Students in 2007 and 4,485 Students in 2012 (-4.7%) DISD had 173,444 Students in 2007 and 174,351 Students in 2012 (+0.5%)
The Study Design • “Quasi- Experimental” • We consider the opening of the DART Green Line as a driver of neighborhood change • We hypothesize that the change will vary by distance from the stations • If this is true, outcomes such as child’s adjustment in school that depend on neighborhood will be different depending on location relative to the stations • We need observations before and after the openings and at various distances • Observations from locations farther away serve as “controls”; we contrast the outcomes nearby to the controls to understand if neighborhood matters.
Data Components • Built Environment Survey—physical condition of parcels and phase blocks; 100% neighborhood sample • Commercial Survey—location of food sources, beer/liquor stores, financial services and pharmacies • Brief Household Survey—geographically weighted sample; conducted door-to-door (Phases 1 and 3) • Detailed Household Survey—sample selected from participants who participated in the brief survey; conducted at field research station (Phases 2 and 4) • Economic Experiments—sample randomly selected from participants in the detailed survey; conducted at field research station (Phases 2 and 4) • Physical Activity Objective Measures—sample randomly selected form participants in the detailed survey (Phases 2 and 4)
Study Timeline • Built Environment Survey • Phase 1 (Brief survey) • Commercial Survey • Phase 2 (Detailed survey & experiments) • Phase 3 (Brief Survey, repeated) • Phase 4 (Detailed Survey & Experiments, repeated) • Continue Phase 2 • Built Environment Survey • Finish Phase 4; • Built Environment Survey • Commercial Survey
Built Environment Measures • Parcel conditions • Face block conditions • Existence of neighborhood amenities (trees, sidewalks) and nuisances (boarded/broken windows, unkempt lawns)
Household Survey Measures • Demographics • Time Usage • Crime/Safety Perceptions • Finance • Health • Children • Neighborhood Perceptions • Perceptions of self • Housing • Social Capital/Trust • Transportation Phase 1 and 2 touch on all of these areas, with much more detail provided in Phase 2.
Economic Experiments • Trust and Reciprocity • Time Preferences • Risk Preferences • Comparative Dictator • Solidarity
Recruitment and Data Collection 6-12 field researchers with knowledge of the community • Conducted all built environment and commercial surveys using tablet PC’s equipped with GIS software • Conducted door-to-door brief surveys for Phase 1 and 3. • Recruited participants for Phase 2 and 4; and conducted detailed survey at field research station.
Recruitment and Data Collection The field research station is located just a few blocks from the main intersection in the neighborhood. Transportation was provided when requested.
Does Proximity to Train Stations Relate to Attendance in School? • 1,223 DISD kids living in the same place in 2007 and 2012 • 58 live in the 0.25 mile treatment area • 126 live in the 0.5 mile treatment area • 38 where in third or fourth grade in May 2008 • Attendance rate for this group increased by approximately 1% (“difference-in-difference” estimator) • Attendance did not change significantly in any other group.
Does Proximity to Train Stations Relate to Property Values? • Overall values significantly decreased with in the 0.25 mile treatment when compared to the control area (difference-in-difference estimate is -$18,270) No significant change in the 0.5 mile treatment. • Single family resident values significantly decreased in both treatment areas when compared to the control area (difference-in-difference estimates are -$3,911 and -$1,315, respectively)
Our studies • http://Ncri.utdallas.edu