Download
1 / 14
140 likes | 251 Views
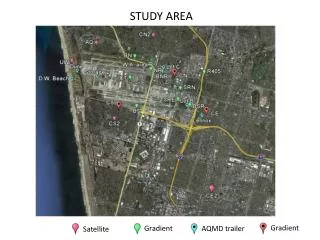
LANDING TIME-SERIES DATA IN A COASTAL MEDITERRANEAN LAGOON SYSTEM. ECOLOGICAL STAGE, TEMPORAL PATTERNS AND FISHERIES PRODUCTION FORECASTING ANALYSIS Zoulias Th. HCMR, Institute of Oceanography, P.O. Box 19013, Anavissos, Attica, e-mail: tzoulias@ath.hcmr.gr. THE STUDY AREA. Logarou lagoon:

E N D
LANDING TIME-SERIES DATA IN A COASTAL MEDITERRANEAN LAGOON SYSTEM. ECOLOGICAL STAGE, TEMPORAL PATTERNS AND FISHERIES PRODUCTION FORECASTING ANALYSISZoulias Th. HCMR, Institute of Oceanography, P.O. Box 19013, Anavissos, Attica, e-mail: tzoulias@ath.hcmr.gr
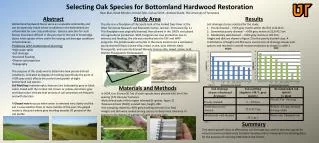
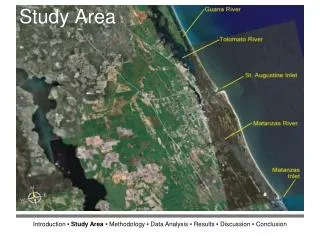
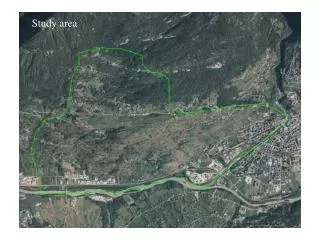
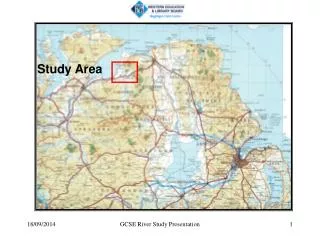
THE STUDY AREA Logarou lagoon: Total surface = 26km2 Mean production = 134tn Depth = 0,2m – 1,6m Reed beds domination Sand muddy bottom
The IDEA: A coastal lagoon as, due to its finite magnitude, it is possible to accurately assess the extension of the fishing ground and to obtain more reliable fisheries data. So, the differentiation of fishing effects from long-term changes associated with other anthropogenic and natural disturbances can be allowed. AIMS OF THE STUDY • to analyze the modifications of the ecosystem structure in the Logarou lagoon by comparing the time series of landings and the ecological indices • to evaluate temporal variations in the study lagoon based on the fish biomass distribution across trophic levels and • to estimate a short-term environmental and fisheries state in the study system
Material & Methods • Annual fishery landings data from the barrier fish traps for the period = 1980 – 2003 • Ecological indices: mTrL=Σ(Υjk*TLj)/ΣΥjk Yjk=the landing of species j in the year k TLj=1+ΣDCij*TLi (number ranging from 2-5) FiB=log(Yk/Yo)+(mTrLK-mTrLo)*log(1/TE) Yk=Landings in year k, Yo=Landings for the first year (1980) (TE=Trophic energy estimated as 10%) P/D=Ratio between the plankton feeder groups and the predators-benthic groups • BTLS as indicator of multifactor impacts • ARIMA forecasting model
Coupling fisheries production and ecological indices FiB=0, TL changes and changes in catch are matched FiB<0, Discarding occurs or fisheries overexploitation FiB>0, Increase in primary production or Expanded ecosystem P/D value alterations = alterations in nutrient enrichment or fisheries management
RESULTS: COMPOSITION OF THE SPECIES The landings data is composed by 9 species or group of fishes that were aggregated into 5 trophic groups
RESULTS: Fisheries landings Fishing gears & leasing regime stable FDFW effect in the period 1994-1997
RESULTS: Ecological indices showed alterations in the system structure, decrease in the productivity of the system as well as a positive trend in the system eutrophication. Fisheries landings have a negative trend.
1998-2002 1980-1984 RESULTS: CUMMULATIVE RELATIVE BTLS Tendency of change from a sigmoid pattern (blue line), to a linear form (green dashed line). Trend of significant differences between the periods 1980-1984 and 1998-2002 (t-test, p=0,052). Alterations in the fisheries landings as well as in the fisheries composition.
RESULTS: ARIMA forecasting model Time-series model=(0,2,1) Confidence level=90% Forecasting period=2004-2008 • Positive trend of the future main fishing yield • Limited reliability of the model
CONCLUSIONS • The analysis of the fisheries landings and the ecological indices showed a lot of variability that hamper consistent and significant identification of trend and dynamics. • BTLS index confirmed tracking changes in the trophic structure. Thorough evaluation is needed to link the shape with specific impacts from the watershed. • The ARIMA model is introduced by uncertainty and an application of another management model is needed. • Responses in the system must be part of an integrated management plan that will cover the social-economic activities of the watershed in which the system belongs.