Download
1 / 7
70 likes | 229 Views
Long Term Decline of South Pole Neutron Monitor Counting Rate – A Possible Magnetospheric Interpretation. Paul Evenson , John Bieber, John Clem , Roger Pyle and Suyeon Oh. Abstract.

E N D
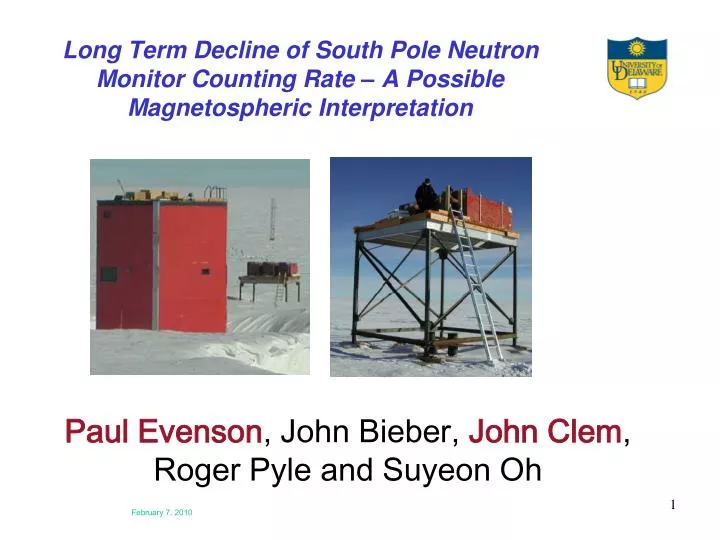
Long Term Decline of South Pole Neutron Monitor Counting Rate – A Possible Magnetospheric Interpretation Paul Evenson, John Bieber, John Clem, Roger Pyle and Suyeon Oh February 7, 2010
Abstract The neutron monitor at the Amundsen Scott Station, located at the geographic South Pole, has operated with some interruptions since 1964. The neutron counting rate follows an 11-year cycle with maxima at times of low solar activity, but over the entire interval exhibited a steady decline, totaling approximately 10% by 2013. We have worked extensively to identify possible instrumental or environmental sources of this decline but to date have found none. Conventionally, the geomagnetic cutoff at South Pole is assumed to be negligible and therefore any possible changes are irrelevant. This is certainly true for the vertical cutoff, but our calculations indicate that there are areas of quite high cutoff at large zenith angles and that the solid angle subtended by these areas is increasing as the geomagnetic field evolves with time. In this paper we explore the question of whether this increasing cutoff at high zenith angle could influence the radiation environment at the surface of the polar ice cap. February 7, 2010
Neutron Monitors Neutron monitors count ~ 100 MeV neutrons produced in atmospheric cascades by “primary” cosmic rays. They are typically used to study variations in the intensity of the cosmic rays, here shown by the inverse correlation with solar activity level. February 7, 2010
Observation: Secular Change 1964 to Present All neutron monitors show some secular change. However the South Pole monitor stands out when compared to the ensemble of “atmosphere limited” monitors which, as a group, exhibit little or no secular change. An “atmosphere limited” monitor is one where those primary particles whose arrival is affected by the magnetosphere have energy too low to produce counts in the monitor. February 7, 2010
Investigation: We Believe This Is Real As the physicians say, “When you hear hoofbeats, think horses, not zebras” We have worked diligently to eliminate “horses” such as instrumental and environmental effects, as well as a possible secular change to the primary cosmic ray spectrum as the cause of this decline, and have found no reason to doubt it. There is actually one major physical difference between South Pole and the other monitors in that South Pole is located at a pressure altitude of approximately 3300 meters whereas the others are near sea level. We are therefore turning to an examination of a “zebra”, namely the assumption that the South Pole monitor really is not “atmosphere limited” February 7, 2010
Our present hypothesis is that the high altitude (3300 m) makes the South Pole monitor unusually sensitive to primary particles arriving at high zenith angles.The potential implication is that cosmogenic nuclide production in general is not adequately understood in the polar atmosphere. February 7, 2010
Geomagnetic Cutoff “Sky Map” at South Pole in 2005 (left) and change from 1969 to 2005 (right). Color scales give the cutoff and change in cutoff in units of GV. Black indicates no change. Virtually all directions have either increased or unchanged cutoffs. [Cutoffs >40 GV are treated as equal to 40 GV so no change is reported at these high rigidities.] February 7, 2010