Download
1 / 18
180 likes | 369 Views
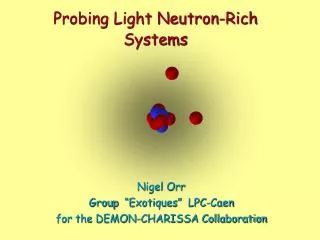
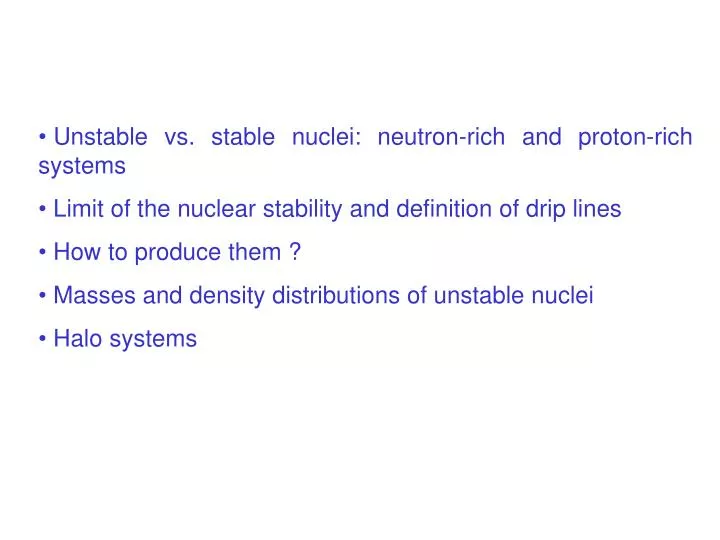
Unstable vs. stable nuclei: neutron-rich and proton-rich systems Limit of the nuclear stability and definition of drip lines How to produce them ? Masses and density distributions of unstable nuclei Halo systems. From: Exotic Nuclei, J. Enders, TU Darmstadt, Summer 2003.

E N D
Unstable vs. stable nuclei: neutron-rich and proton-rich systems • Limit of the nuclear stability and definition of drip lines • How to produce them ? • Masses and density distributions of unstable nuclei • Halo systems
In the previous figure: black dots correspond to stable nuclei: i.e., infinite lifetime. Stable nuclei can be found around the so-called stability line. First problems: for each A (that is, for each isobaric chain), what is the nucleus with largest binding energy ? And how does this evolve if we move towards right (left) in the previous figure, that is, if we move increasing (decreasing) (N-Z) ?
Values: aV=15.85 MeV aS=18.34 MeV aC=0.71 MeV aA=23.21 MeV The blue line represents constant A: for A=120 we meet Z0 close to 50 (i.e., Sn).
Around the “most stable” nucleus there are other stable systems. If we increase the number of neutrons with respect to the protons, we expect to go towards beta instability. Why ? Remember: the pp and nn force is active only in T=1 channel (on the average, not so much attractive) whereas the pn force is active also in the T=0 channel which provides attraction. This is known from the existence of the deuteron as bound systems and the non-existence of the di-neutron. Therefore, neutrons feel more the proton attraction than the attraction of the other neutrons. In a system with increasing N-Z, the neutrons become less bound with respect to the protons. This leads to β-instability. For analogous reasons, if we decrease N-Z we meet a region of β+instability.
Lifetimes for beta-decay can be quite long and nuclei can nonetheless can be studied nowadays using RIB (Radioactive Isotope Beam) facilities. We meet, by further increasing (or decreasing) N-Z the neutron (proton) drip line. These are defined as the limits beyond which the systems are unstable against particle emission. In the case of neutrons, the one-neutron or two-neutron separation energies (Sn = BE(N)-BE(N-1) or S2n) become zero. In certain cases, systems beyond the drip lines can be studied: for instance, if the lifetime is relatively long due to the fact that the extra neutron (or proton) has a resonant state available. But this is not the rule !
Measurements of masses, sizes, densities of radioactive nuclei • Masses (or equivalently binding energies) can be measured with good accuracy by means of mass spectrometry. • The difference between stable and unstable nuclei comes at the level of density measurements. In the case of stable nuclei, electron scattering has been the main source of information. The electromagnetic interaction is known, and this has allowed to interpret the data since the differential elastic cross section for electron scattering is expected to be the Mott cross section (corresponding to the diffusion on a point charge) multiplied by the form factor F(q2) squared, that is, the Fourier transform of the nuclear charge density, • In the case of unstable nuclei, this is not possible. Sizes and densities have been measured using hadron scattering → with the associated uncertainities !
Examples: 11Li and 11Be (courtesy: T. Nakamura) Ne F O N=20 N C Neutron halos B Z Be Neutron Dripline Li He H N=8 11Li 19C N 11Be 14Be 2n halo nucleus 1n halo nucleus n 9Li 11Li n 10Be 11Be n Sn=504 keV S2n=300 keV
Let us the model (oversimplified !) for the case of 11Be, which is a one-neutron halo. We know Sn is about 0.5 MeV, so that η~1/6 fm-1. The size of the neutron orbit in 11Be is two times the core size R0 A1/3 = 2.67 fm
Other evidences • Other experiments which have been historically important, to make the character of halo nuclei evident, are: (i) momentum distributions of projectile fragments, and (ii) electromagnetic dissociation. • These are reviewed in papers e.g. by I. Tanihata. • The idea of the momentum distribution experiments is quite simple. If we hit, e.g., 11Li on a C target at 800 MeV/u we can measure the transverse momentum of the fragments and we find a “double” distribution. • The component with “small width” has a Δp of about 19 MeV/c. From the uncertainity principle • Δx ~ hc/Δp ~ 12 fm, • that is, the narrow component is arising from the halo.