Download

1 / 16
160 likes | 170 Views
Upper Bear River Watershed Analysis using Topmodel. Project Objective and Process. To model specific storm event using Topmodel in the ArcGIS environment Data collection Terrain and Watershed Processing Topmodel explanation Results. Watershed Selection. Upper Bear River

E N D
Project Objective and Process • To model specific storm event using Topmodel in the ArcGIS environment • Data collection • Terrain and Watershed Processing • Topmodel explanation • Results
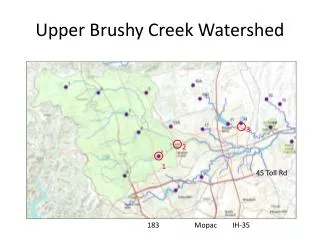
Watershed Selection • Upper Bear River • Uinta Mountain Range • Relatively Undeveloped • Data readily available • Watershed with stream gage and precipitation data available
GIS Data Collection • www.bearriverinfo.org • Climate • Environmental • Geology • Hydrology • Terrain • Watersheds
Data Preparation • DEM – 100 m X 100 m • NAD 83 – UTM Zone 12 N
Terrain and Watershed Processing using TauDEM • Only outputs used were: • demw – watersheds • demsca – dinf contributing area • demslp – dinf slopes
Topmodel Introduction • Conceptual model for runoff production • Developed for small upland catchments in the U.K. • After calibration Topmodel has been used in other humid temperate climates such as eastern U.S. • Successful models of mountain catchments in France and Spain after soil has “wetted up”
Topmodel Procedure • Assumption 1: Dynamics of saturated zone are approximated by steady state representations • Assumption 2: Hydraulic gradient of saturated zone is approximated by local surface topographic slope • Assumptions: • Ko=5 m/hr (hydraulic conductivity) • f=2 1/m (scaling parameter) • ne=0.25 (effective porosity)
Precipitation Event • Precipitation Event: P = 0.5 inches from Sept. 19 – 21, 2004
Q • Qb = 44 cfs or 10800 m3/day from USGS stream gage 0.2 in 0.3 in
mask demw – watersheds Mask – raster with values of 1 where demw was
λ Lambda demsca – dinf contributing area demslp – dinf slopes
Topmodel Calculations • Z’ is average depth to water table • Z is depth to water table for each cell
Using Z • Z<0 100% runoff • Z>P/ne 0% runoff • 0<Z<P/ne runoff=P-Z*ne
Results • 284,673 m3 from Topmodel • 173,779 m3 from USGS stream gage • About 60% overestimation
Conclusions and reasons for error • More research is needed for Ko and ne assumptions • The watershed was not properly wetted up