Download
1 / 1
10 likes | 171 Views
700 psia. 500. 400. 600. Empirical Modeling of a Rolling-Piston Compressor Heat Pump for Predictive Control in Low-Lift Cooling . 300. 60. Predictive pre-cooling of thermal storage (night-shifting) and variable speed fans. Load forecasts. Identify building temperature response models.

E N D
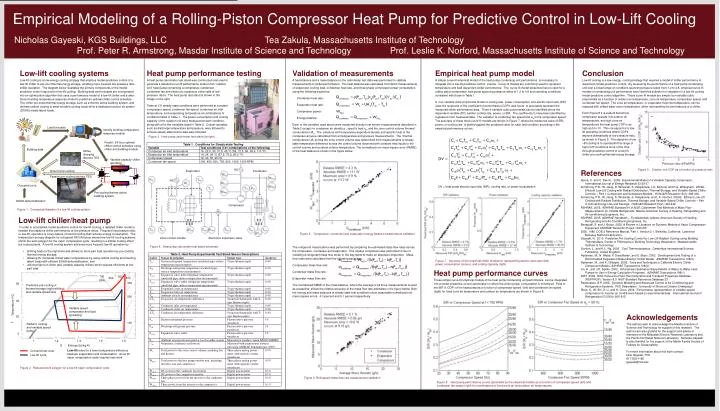
700 psia 500 400 600 Empirical Modeling of a Rolling-Piston Compressor Heat Pump for Predictive Control in Low-Lift Cooling 300 60 Predictive pre-cooling of thermal storage (night-shifting) and variable speed fans Load forecasts Identify building temperature response models Nicholas Gayeski, KGS Buildings, LLC Tea Zakula, Massachusetts Institute of Technology Prof. Peter R. Armstrong, Masdar Institute of Science and Technology Prof. Leslie K. Norford, Massachusetts Institute of Science and Technology 200 40 Predict 24-hour optimal chiller control schedule using chiller and building models T - Temperature (°C) Building data Active charging discrete TES Low-lift cooling systems Low-lift cooling is a low-energy cooling strategy that employs model-predictive control of a low-lift chiller to pre-cool thermal energy storage, enabling more frequent low pressure ratio chiller operation. The diagram below illustrates the primary components of the model-predictive control required for low-lift cooling. Building data and forecasts are incorporated into an optimization algorithm that uses a performance model of a low-lift chiller and a data-driven building temperature response model to predict an optimal chiller control schedule. The chiller pre-cools thermal energy storage, such as a thermo-active building system, and delivers radiant cooling to meet sensible cooling loads while a dedicated outdoor air system (DOAS) meets latent loads. • Heat pump performance testing Empirical heat pump model A simple curve-fit empirical model of the heat pump condensing unit performance is necessary to integrate into a low-lift predictive control volume. Curve-fit models are commonly used to represent temperature and load dependent chiller performance. The curve-fit model presented here is valid for a rolling-piston compressor heat pump spanning pressure ratios of 1.2 to 4.8 and operating conditions consistent with those in Table 1. A four-variable cubic polynomial model of cooling rate, power consumption, and electric input ratio (EIR) (also the reciprocal of the coefficient of performance (COP)) was found to accurately represent the measured chiller performance data. Three 4-variable cubic polynomials can be identified where the dependent variable (DV) iseither cooling rate, power, or EIR. The coefficients Cihave been identified by regression from measured data. The variable f is condenser fan speed and ωc is the compressor speed. The accuracy of these three curve-fit models are shown in Figure 7, where the measured value of EIR, power, or cooling rate is plotted against the predicted value for each test condition according to the empirical performance curves . Conclusion Low-lift cooling is a low-energy cooling strategy that requires a model of chiller performance to implement model-predictive control. By measuring the performance of a heat pump condensing unit over a broad range of conditions spanning pressure ratios from 1.2 to 4.8, empirical curve-fit models of condensing unit performance were identified suitable for integration in a low-lift cooling model-predictive control algorithm. These curve-fit models are simple four-variable cubic polynomials as a function of outdoor air temperature, zone air temperature, compressor speed, and condenser fan speed. The zone air temperature, or evaporator fluid inlet temperature, can be replaced with chilled water return temperature when representing the performance of a chiller. • Validation of measurements • A heat balance and a mass balance on the calorimeter test data was performed to validate measurements of chiller performance. The heat balance was calculated from direct measurements of evaporator cooling load, condenser heat rate, and three phase compressor power consumption using the following equations: • Condenser heat rate: • Evaporator heat rate: • Compressor power: • Energy balance: • Each of the variables used above were measured directly from sensor measurements described in Table 2 except for condenser air density ρ , specific heat cp, and the zone control volume thermal conductance UAz. The pressure and temperature dependent density and specific heat of the condenser air were calculated from air temperature and pressure measurements. The thermal conductance UAzacross the zone control volume was determined from measurements of steady-state temperature difference across the control volume observed with constant heat inputs to the control volume and constant outdoor temperature. The normalized root mean square error (RMSE) of the heat balance is shown in the figure below. Variable capacity chiller operation Variable speed compressor and load spreading A heat pump calorimeter test stand was constructed and used to generate a detailed curve-fit performance model of an “outdoor unit” heat pump comprising a compressor, condenser, condenser fan and electronic expansion valve valid at low pressure ratios. The heat pump test stand is shown in the image on the right. Tests at 131 steady-state conditions were performed at constant compressor speed, condenser fan speed, condenser air inlet temperature, and evaporating temperature at combinations of conditions listed in Table 1. The power consumption and cooling capacity of the outdoor unit were measured at each condition, along with all of the variables listed in Table 2. Critical variables, such as discharge temperature and pressure, were allowed to achieve steady state before data was collected. Direct zone cooling 100 Radiant cooling and variable speed pump Passive pre-cooling intrinsic TES Occupied zone 0 Evaporator Condenser From Figure 8 it is evident that at low compressor speeds, low outdoor air temperatures, and high zone air temperatures the heat pump COP is as high as 5 to 10. This correspond s to low-lift operating conditions where COPs improve dramatically at low pressure ratio, as shown in Figure 9. The objective of low –lift cooling is to operatedin this range of high COP conditions more of the time through predictive control of a low-lift chiller pre-cooling thermal energy storage. Pre-cooling thermo-active building system 1 1.2 1.4 1.6 1.8 S - Entropy (kJ/kg-K) Figure 3. Heat pump calorimeter test stand (at right) Low-lift refers to a lower temperature difference between evaporation and condensation. A low lift vapor compression cycle requires less work Compressor Figure 9. Outdoor unit COP as a function of pressure ratio References Aprea, C. and C. Renno. 2009. Experimental Model of a Variable Capacity Compressor. International Journal of Energy Research 33:29-37. Armstrong, P.R., W. Jiang, D. Winiarski, S. Katipamula, L.K. Norford, and R.A. Willingham. 2009a. Efficient Low-Lift Cooling with Radiant Distribution, Thermal Storage, and Variable-Speed Chiller Controls – Part I: Component and Subsystem Models. HVAC&R Research 15(2): 366-400. Armstrong, P.R., W. Jiang, D. Winiarski, S. Katipamula, and L.K. Norford. 2009b. Efficient Low-Lift Cooling with Radiant Distribution, Thermal Storage, and Variable-Speed Chiller Controls – Part II: Annual Energy Use and Savings. HVAC&R Research 15(2): 402-432. ASHRAE. 2005. ASHRAE Standard 41.9-2005, Calorimeter Test Methods of Mass Flow Measurements for Volatile Refrigerants. Atlanta: American Society of Heating, Refrigerating and Air-conditioning Engineers, Inc. ASHRAE. 2005. ASHRAE Handbook – Fundamentals. Atlanta: American Society of Heating, Refrigerating and Air-Conditioning Engineers, Inc. Benapudi, S. and J. Braun. 2002. A Review of Literature on Dynamic Models of Vapor Compression Equipment. ASHRAE Research Project 1043-RP. DOE. 1980. DOE 2 Reference Manual, Part 1, Version 2.1. Berkeley, California: Lawrence Berkeley National Laboratory. Gayeski, N. 2010. Predictive Pre-Cooling Control for Low-Lift Radiant Cooling using Building Thermal Mass. Doctor of Philosophy in Building Technology dissertation. Massachusetts Institute of Technology. Gordon, J., and K.C. Ng. 2000. Cool Thermodynamics. Cambridge International Science Publishing. United Kingdom. Hydeman, M., N. Webb, P. Sreedharan, and S. Blanc. 2002. Development and Testing of a Reformulated Regression-Based Electric Chiller Model. ASHRAE Transactions 108(2) Hydeman, M., and K. Gillespie. 2002. Tools and Techniques to Calibrate Electric Chiller Component Models. ASHRAE Transactions 108(2): Jin, H., and J.D. Spitler. 2002. A Parameter Estimation Based Model of Water-to-Water Heat Pumps for Use in Energy Calculation Programs. ASHRAE Transactions 108(1) NIST. 2009. NIST Reference Fluid Thermodynamic and Transport Properties Database (REFPROP): Version 8.0. NIST Standard Reference Database 23 Rasmussen, B.P. 2005. Dynamic Modeling and Advanced Control of Air Conditioning and Refrigeration Systems. PhD Dissertation. University of Illinois at Urbana-Champaign. Shao, S., W. Shi, X. Li, and H. Chen. 2004. Performance representation of variable-speed compressor for inverter air conditioners based on experimental data. International Journal of Refrigeration 27(2004): 805-815. Zone control volume Electronic expansion valve DV = heat pump electric input ratio (EIR), cooling rate, or power consumption Figure 1. Conceptual diagram of a low-lift cooling system • Low-lift chiller/heat pump • In order to accomplish model-predictive control for low-lift cooling, a detailed chiller model is needed that captures chiller performance at low pressure ratios. Frequent low pressure ratio, or low-lift, operation is a key feature of low-lift cooling that reduces energy consumption. The temperature-entropy diagram for refrigerant R410A below shows how low-lift cooling systems shrink the work polygon for the vapor compression cycle, resulting in a similar cooling effect but reduced work. A low-lift cooling system achieves more frequent low-lift operation by: • shifting loads to the night time and allows for more part load operation by pre-cooling thermal energy storage, • allowing for moderate chilled water temperatures by using radiant cooling and meeting latent loads with efficient DOAS dehumidification, and • utilizing high turn down ratio variable capacity chillers which operate efficiently at low part load. DOAS dehumidification Figure 5. Compressor, condenser and evaporator energy balance measurement validation Figure 4. Heat pump calorimeter test stand schematic The refrigerant mass balance was performed by comparing the estimated mass flow rates across the compressor, condenser and evaporator. This relative comparison was performed in lieu of installing a refrigerant mass flow meter in the test stand to make an absolute comparison. Mass flow rates were calculated from the following equations.. Compressor mass flow rate: Condenser mass flow rate: Evaporator mass flow rate: The normatlized RMSE of the mass balance, where the average of all three measurements is used as a baseline, shows the relative accuracy of the mass flow rate estimates in the figure below. Both the energy and mass balances at steady state test conditions show reasonable normalized root mean square errors, 4.3 percent and 5.1 percent respectively. Figure 7. Accuracy of the empirical chiller models for representing electric input ratio (left) power consumption (center), and cooling capacity (right) Heat pump performance curves These simple curve-fit empirical models of the heat pump condensing unit performance can be integrated into a model-predictive control optimization in which the chiller power consumption is minimized. Plots of the EIR (1/COP) of the heat pump as a function of compressor speed (left) and condenser fan speed (right) for fixed zone air temperature and outdoor air temperature are shown in Figure 8. Acknowledgements The authors wish to acknowledge the Masdar Institute of Science and Technology for support of this research. The authors are also grateful for the support and advice of members of the Mitsubishi Electric Research Laboratory and the Pacific Northwest National Laboratory. Nicholas Gayeski is also thankful for the support of the Martin Family Society of Fellows for Sustainability. For more information about this work contact: Nick Gayeski, PhD 617-835-1185 gayeski@mit.edu 20 Conventional cycle Low lift cycle Figure 2. Reduced work polygon for a low-lift vapor compression cycle Figure 6. Refrigerant mass flow rate measurement validation Figure 8. Heat pump performance curves generated by the empirical models as a function of comrpessor speed (left) and condenser fan speed (right) for combinations of fixed zone air and outdoor air temperatures.