Download
1 / 16
160 likes | 257 Views
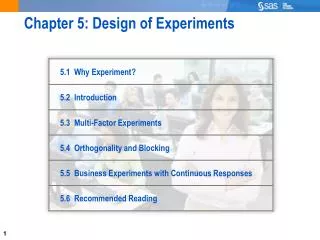
ECE-1467 Subsurface Imaging Course Notes Part 5: Lab Experiments. Profs. Brooks and DiMarzio Northeastern University Spring 2004. HOSIS Instrumentation Block Diagram. Processed Images. Halogen Lamp. CCD Camera. Tunable Filter See Supplementary Notes. Computer System with Video Board.

E N D
ECE-1467Subsurface ImagingCourse NotesPart 5: Lab Experiments Profs. Brooks and DiMarzio Northeastern University Spring 2004 C. DiMarzio/M. Costanzo, NU
HOSIS Instrumentation Block Diagram Processed Images Halogen Lamp CCD Camera Tunable Filter See Supplementary Notes Computer System with Video Board Target Tissue Thanks to Peter Dwyer at Lucid Technologies, MGH, and NU C. DiMarzio/M. Costanzo, NU
Hyperspectral Imager Camera Filter (Polarized Input) Light Source (Quartz-Halogen Through Fiber) With Polarizer Object Plane C. DiMarzio/M. Costanzo, NU
Why Polarized Light? Multiple Scatter tends to Destroy Polarization Single Scatter tends to Preserve Polarization (Not always, of course) Vert Vert Hor Hor C. DiMarzio/M. Costanzo, NU
2N-1 Signal Voltage 0 Live-Capture Mode • Frame the Picture • Adjust Exposure • Monitor Zeros • Shown in Blue • Monitor Saturation • Shown in Pink C. DiMarzio/M. Costanzo, NU
HSI Programs An Introduction to the tools used for Hyperspectral Imaging C. DiMarzio/M. Costanzo, NU
Frame Grabber • GUI • Allows user to input starting and final wavelengths, steps between and average pictures per. • Shows real time images for target alignment and focusing C. DiMarzio/M. Costanzo, NU
Frame Grabber Screenshot C. DiMarzio/M. Costanzo, NU
qFinder • The Q Finder measures pixel values for the user defined bandwidth and adjusts attenuation where needed. C. DiMarzio/M. Costanzo, NU
qFinder function call and Screenshots • qFinder(target_count, start, step, stop) • qFinder(200,400,10,720) C. DiMarzio/M. Costanzo, NU
hsi3 • Shows cross sections of the HSI data cube, and measures reflectance spectrum for selected regions. C. DiMarzio/M. Costanzo, NU
hsi3 function call and Screenshot • Hsi3(data, wavelengths, hilimit) • hsi3(Whole_Image,wavelength_list, 1) C. DiMarzio/M. Costanzo, NU
MATLAB Command Lines Run our GUI-based framegrabber program fg fg; save moose elk caribou wombat Matlab function to save a file called moose.mat containing the variables elk, caribou, and wombat. load moose Matlab function to load all the variables stored in moose.mat hsi3(elk,wavelength_list,255); Display the datacube elk, with wavelength_list on the wavelength axis, and a colorbar that goes from 0 to 255. C. DiMarzio/M. Costanzo, NU
More MATLAB Command Lines imagesc(squeeze(elk(:,:,3)); Matlab function to show an image as a function of x and y for the third value of wavelength. axis image; colorbar; Matlab functions to make pixels equal size in both directions and to display a colorbar beside it. showmepics(elk,255); Our function to run imagesc on every wavelength. imagesc(squeeze(elk(:,200,:)); Matlab function to show an image as a function of wavelength and y for the 200th value of y. C. DiMarzio/M. Costanzo, NU
A Sample Run: Collection Image the White Standard fg; id=‘White’ save white Whole_Image wavelength_list id hsi3( Whole_Image,wavelength_list,255); Check Levels Image the Object fg; id=‘Moose’ save moose Whole_Image wavelength_list id hsi3( Whole_Image,wavelength_list,255); Check Levels C. DiMarzio/M. Costanzo, NU
A Sample Run: Processing Image the Dark Level (Not Used with this camera) fg; id=‘Dark’ save dark Whole_Image wavelength_list id Instead, Use dark=-23; Load ‘em all and give ‘em the right names. Load and Process load white; white= double(Whole_Image); load moose; moose= double(Whole_Image); load dark; dark= Whole_Image; Calculate the reflectance refl=(moose-dark)./(white-dark); Max value “should” be 1.0? hsi3(refl,wavelength_list,1.2); C. DiMarzio/M. Costanzo, NU