Download

1 / 101
1.06k likes | 1.68k Views
Current & Future of PET Imaging in Alzheimer’s Disease. Niraj R. Patel, MD May 2011. My Talk’s Outline. Alzheimer’s disease Nuclear Imaging in AD SPECT FDG PET Amyloid PET. Alzheimer’s Disease. AD is an irreversible neurodegenerative disease that affects memory, thinking and behavior.

E N D
Current & Future of PET Imaging in Alzheimer’s Disease Niraj R. Patel, MD May 2011
My Talk’s Outline • Alzheimer’s disease • Nuclear Imaging in AD • SPECT • FDG PET • Amyloid PET
Alzheimer’s Disease • AD is an irreversible neurodegenerative disease that affects memory, thinking and behavior • Of 3.4M Americans with dementia, 2.4M have AD (Plassman et al. Neuroepid. 2007) • 6th leading cause of death in US • Only top 10 COD that’s not preventable or curable • Incidence ↑ in past decade
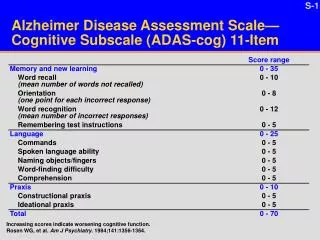
Alzheimer’s Disease Amyloid protein Tau protein Amyloid β peptides secreted by brain cells normally soluble and cleared away. But when Aβ peptides become insoluble, they collect in intercellular space. Aβ fibrils corralled by chaperone proteins. Large plaques form, which damage neurons and attract reactive cells (microglia and astrocytes) which cause further damage. Inside neuron, tau proteins normally stabilize microtubules in brain cells. But when they undergo abnormal chemical changes and assemble into spirals called paired helical filaments, they create tangles that disrupt cell functions and lead to apoptosis. Source: Petrella JR et al. “Neuroimaging and Early Diagnosis of Alzheimer Disease: A Look to the Future.” Radiology 2003; 226: 315-336.
Alzheimer’s Disease Diagnosis • 1st, is there a cognitive deficit? • 2nd, if so, are multiple such deficits present? • 3rd, is there functional decline too? • 4th, can depression, drug abuse, malnutrition, electrolyte imbalance, hypothyroidism, anemia, et al be ruled out? • 5th, can structural abnormalities (eg, vascular insults, NPH) be ruled out with anatomic imaging? • 6th, it is probably (or possibly) Alzheimer’s Disease
Alzheimer’s Disease Treatment • 4 cholinesterase inhibitors & 1 NMDA receptor agonist • Donepezil (Aricept) & 3 others • Memantine (Namenda) • Mayo Clinic group followed 769 patients with amnestic MCI (aMCI) in 3 treatment arms – Vitamin E, donepezil, or placebo – for 3 years (Petersen et al. NEJM 2005.) • Donepezil delayed progression to AD in first 12 months • By 36 months, incidence of progression was same in all 3 treatment arms
Nuclear Imaging Brief History of Functional Imaging of Alzheimer’s Disease
Nuclear Imaging Timeline in AD • Early 1980s: FDG PET showed glucose ↓M in temporoparietal & posterior cingulate cortex, milder in frontal cortex • Mid 1980s: Tc-99m SPECT showed cerebral ↓P in same regions • Mid 1990s: Direct comparisons showed PET may be better • Qualitatively distinguishing between normal and abnormal brain tissue • But SPECT cheaper and widely available in 1990s Herholz K et al. “Direct Comparison of Spatially Normalized PET and SPECT Scans in Alzheimer’s Disease.” JNM 2002; 43:21–2.
Brain Anatomy Source: Berkeley Brain Games. Hosted by UC-Berkeley. Accessed 11 May 2011.
Brain Anatomy Precuneus Posterior Cingulate Gyrus Source: fMRI for Newbies. Hosted by U. of Western Ontario Dept. of Psychology. Accessed 11 May 2011.
SPECT in AD • 99mTc-HMPAO • Lipophilic complex freely crosses BBB and neuronal cell membrane • Remains trapped inside perfused, presumably converted to hydrophillic complex inside neuron, and remains there until reconverted and cleared • Decreased perfusion in temporoparietal cortex is characteristic of AD OPTIMA. “Accurate diagnosis in life: SPECT scans.” Oxford University. Updated 2009. Accessed 8 May 2011.
SPECT in AD • 70 dementia & 14 control patients followed to autopsy • “Probable AD” dx correct in 84% • “Probable AD” plus Positive SPECT for AD correct in 92% • “Possible AD” dx correct 67% “Possible AD” plus Positive SPECT correct 84% • Sn63% of SPECT alone • Sp82% of SPECT alone Johnson KA and Becker JA. “The Whole Brain Atlas.” Harvard Medical School. Accessed 8 May 2011. Jagust W et al. “SPECT perfusion imaging in the diagnosis of Alzheimer’s disease.” Neurology 2001; 56: 950-6.
Which detects AD better, SPECT or PET? A study looking at clinically diagnosed patients Herholz K et al. “Direct Comparison of Spatially Normalized PET and SPECT Scans in Alzheimer’s Disease.” JNM 2002; 43:21–2.
Comparing SPECT to PET • On qualitative interpretation, PET better than SPECT • But quantitative comparison never done • Previous studies done on older cameras • Herholz’s team in Germany studied 26 patients dx’d as “Probable AD” based on clinical and neuropsychiatric evaluation • Excluded if organic brain disease, h/o head injury, metabolic or systemic disease, drug abuse, abnormalities on MRI or CT, abnormal labs • 9 healthy controls Herholz K et al. JNM 2002.
Comparing SPECT to PET • All patients had 99mTc HMPAO SPECT and 18F FDG PET studies (about 9 days apart) • SPECT and PET images processed same way and normalized • ~266,000 voxels (2 x 2 x 2 mm) • Spatial resolution: SPECT ~10 mm vs. PET ~ 4 mm • z-maps made using differences of voxel values, analyzed for correspondence or discordance Herholz K et al. JNM 2002.
Comparing SPECT to PET • Correlation using Pearson coefficient between PET and SPECT z-maps was 0.43 • Almost 0.6 if patient severely demented (MMSE value < 20) MMSE 18 MMSE 21 Herholz K et al. JNM 2002.
Comparing SPECT to PET • Correlation between PET and SPECT closest in • Temporoparietal • Posterior Cingulate Herholz K et al. JNM 2002.
Comparing SPECT to PET • Sn63% & Sp93% of SPECT detecting “Probable AD” • PET distinguished between normal & “Probably AD” brains after adjusting z-value treshold to point where SPECT couldn’t • PET more sensitive • FDG PET has increased accuracy by 15-20% in MCI patients over HMPAO SPECT • Limitations of SPECT • Spatial resolution • Magnitude of ΔM > that of ΔP (Herholz et al. JNM 2002) • Perfusion poorer proxy for nerve cell function than glucose metabolism Silverman DHS. Brain 18F-FDG PET in the Diagnosis of Neurodegenerative Dementia. JNM 2004; 45(4): 594-607.
18F-FDG PET Current Molecular Imaging in Alzheimer’s Disease & Other Dementias
FDG Pattern in Normal Aging Silverman DHS. Brain 18F-FDG PET in the Diagnosis of Neurodegenerative Dementia. JNM 2004; 45(4): 594-607.
Early Alzheimer’s (AD) • ↓M of PCC and associative cortex, esptemporoparietal cortex in mild AD • As AD becomes advanced, ↓M is more global • Sparing of BG, thalamus, cerebellum, and sensorimotor strips Silverman DHS. JNM 2004.
Lewy Body Disease (LBD) Silverman DHS. JNM 2004.
Parkinson’s Disease (PD) Silverman DHS. JNM 2004.
Vascular Dementia Silverman DHS. JNM 2004.
Frontotemporal Dementia (FTLD) Silverman DHS. JNM 2004.
18F-FDG PET in Dementia • Easy to distinguish AD from Vascular Dementia & FTLD • But ↓M in temporoparietal cortex in advanced LBD & PD makes them difficult to distinguish from advanced AD using FDG PET • Don’t use metabolism of temporoparietal cortex alone Silverman DHS. JNM 2004.
Does FDG PET help diagnose and predict progressive dementia? A study looking at both clinical and histopathologic diagnosis Silverman DHS et al. “Positron Emission Tomography in Evaluation of Dementia.” JAMA 2001: 286(17):2120-2127.
Correlating FDG to AD Pathology Longitudinal group: 146 MCI patients at UCLA Postmortem group: 138 MCI patients at 8 centers Autopsies was average 3 years after PET Dx by center’s neuropathologist Classified as ND disease in general, AD specifically PET findings reported to Silverman’s team at UCLA Interpreters at each center blinded to autopsy results • Follow-up was average 3 years after PET scan • Scan read on day of acquisition by blinded ABNM-certified physician • Outcome data reviewed by ABIM-certified physicians and classified as “Probably Progressive” ND disease or Non-progressive (concordance 93%) Silverman DHS et al. JAMA 2001.
Correlating FDG to AD Pathology • “Progressive PET” if • Focal cortical ↓M in parietal, temporal, or frontal lobes; or • Diffuse ↓M in associative cortex; or • Pattern of cerebral M associated with known ND disease Source: Kalabat JP and Fischman AJ. “Autosomal Dominant Alzheimer's Disease.” Joint Program in Nuclear Medicine. Harvard Medical School. Updated 30 Sept 2003. Silverman DHS et al. JAMA 2001.
Correlating FDG to AD Pathology • Non-progressive PET if • Normal FDG pattern • Abnormality didn’t meet “Progressive” criteria (eg, Abnormalities on PET and CT/MRI match) • Interrater concordance of PET impression (using 2nd NM physician) was 94% • Correspondence to clinical course similar (84% versus 82%) Silverman DHS et al. JAMA 2001.
Correlating FDG to AD Pathology • Longitudinal Group: ~60% (86 of 146 patients) had progressive dementia • Sn91%of FDG PET for progressive dementia • 78 of 86 patients with clinical progressive dementia also had positive FDG PET scan (ie, TP’s) • Sp75%of FDG PET for progressive dementia • 45 of 60 patients with no clinical progression had negative FDG PET scan (ie, TN’s) • Be careful when interpreting positive FDG PET Silverman DHS et al. JAMA 2001.
Correlating FDG to AD Pathology • Postmortem Group: 70% (97 of 138) had confirmed AD • Sn94%of FDG PET (91 of 95 with true AD were TP’s) • Sp73%of FDG PET (30 of 41 w/o true AD were TN’s) • Accuracy of FDG PET for true AD 88% Middle frontal gyrus shows neurofibrillary tangles (black arrow) and neuritic plaques (white arrow) using silver stain (a) or tau immunostains (b) Source: Munoz DG et al. “Argyrophilic thorny astrocyte clusters in association with Alzheimer’s disease pathology in possible primary progressive aphasia.” Acta Neuropathologica 2007; 114(4). Via SpringerImages.com. Silverman DHS et al. JAMA 2001.
Correlating FDG to AD Pathology • 75% of 55 patients diagnosed with “questionable or mild dementia” confirmed to have true AD • FDG PET Sn 95% for true AD in mild dementia • FDG PET Sp 71% • FDG PET accuracy 89% Silverman DHS et al. JAMA 2001.
Correlating FDG to AD Pathology • Greatest clinical difficulty: Identifying specific ND disease when only early symptoms present • Negative 18F-FDG PET scan reassuring • Good at ruling out neurodegenerative disease generally • Good at ruling out AD specifically • On other hand, positive FDG PET scan needs careful interpretation by clinician (not always AD) Silverman DHS et al. JAMA 2001.
Is FDG PET cost effective in working up MCI patients? A theoretical model Silverman DHS et al. “Evaluating Early Dementia With and Without Assessment of Regional Cerebral Metabolism by PET: A Comparison of Predicted Costs and Benefits.” JNM. 2002; 43:253-266.
Cost Effectiveness of FDG PET for AD • “The literature suggests it is not cost effective to add functional imaging to the standard diagnostic work-up for Alzheimer’s disease… therapy [is] safe and may be given to people with a general diagnosis of dementia empirically. However, reversible causes of dementia may be less likely to be diagnosed with this line of reasoning (such as depression), and these patients may not receive appropriate treatment.” • “[MRI and even CT] usually reveal nonspecific atrophy… Anatomic studies are most helpful in ruling out other causes of dementia [other than ND disease].” Kalabat JP and Fischman AJ. “Autosomal Dominant Alzheimer's Disease.” Joint Program in Nuclear Medicine. Harvard Medical School. Updated 30 Sept 2003.
Cost Effectiveness of FDG PET for AD • Early diagnosis important because treatment can slow progression of mild/moderate AD • Delays cognitive decline by 9-12 months • Delays institutionalization by 18 months • Helps patients & families prepare • Reduces resources devoted to extensive workups • AAN: “PET scanning appears to have promise for use as an adjunct to clinical diagnosis [of AD],” citing accuracy of 86-100% Silverman DHS et al. JNM. 2002.
Cost Effectiveness of FDG PET for AD Proposed Algorithm • Patient “who presents with an adverse change in cognition or behavior, which has not been fully explained and fully reversed following prompt and standard diagnostic and treatment approaches, should undergo PET imaging” • Made by Silverman’s team at UCLA Conventional Algorithm Step 1. Documenting presence of clinical criteria for dementia Step 2. Deductive process of ruling out other potentially confounding conditions (eg, structural brain lesions, thyroid disease, depression) • Based on Recommendations by AAN, which are endorsed by American Association of Geriatric Psychiatry, Alzheimer’s Association, American Geriatrics Society & AMA Silverman DHS et al. JNM. 2002.
Cost Effectiveness of FDG PET for AD Conventional Diagnosis of AD Proposed Dx of AD using PET Silverman DHS et al. JNM. 2002.
Cost Effectiveness of FDG PET for AD • Clinical dx of “Possible AD” (w/o PET) has Sn 84% and Sp 53% (Lim et al’s JAGS 1999) • Used 3 years of follow-up, not just initial visit for Sn/Sp • Clinical dx of “Probable AD” (w/o PET) had Sn 66% ± 17% (AAN’s estimate using “best evidence”) • FDG PET for AD Sn 94% and Sp 73% (Silverman et al. JAMA 2001.) • Cost values came from Medicare • Brain PET: WB PET/CT x 0.7 [private insurers used this factor, as did UCLA] $1,661 for FDG PET of brain Silverman DHS et al. JNM. 2002.
Cost Effectiveness of FDG PET for AD • Comparison 1: $3,400 using PET vs$3,500 • Dementia patients got MRI w/o contrast only if specific indications • Comparison 2: $4,300 using PET vs$5,700 • All dementia patients got MRI w/o contrast (per new AAN guidelines for dementia workup) • Comparison 3: $4,600 using PET vs$5,800 • All dementia patients got MRI with and w/o contrast (to do perfusion study) Silverman DHS et al. JNM. 2002.
Cost Effectiveness of FDG PET for AD • Algorithm with FDG PET saved $$ • Made more accurate diagnosis of AD than conventional clinical dx Less patients diagnosed with (and managed for) AD • Delayed when patient institutionalized (Largest single cost is long-term institution care) Silverman DHS et al. JNM. 2002.
Cost Effectiveness of FDG PET for AD • PET saves $$ for patients & caregivers • $ of PET scan < $ of 1 year of unnecessary meds • $ of PET scan < $ of 1 month of lost productivity when AD not diagnosed/managed • Surveys show ≥ 80% elders want to be told by doctor if have AD • Most physicians untrained how to diagnose AD • 7 in 8 physicians don’t administer cognitive screening test Silverman DHS et al. JNM. 2002.
Is FDG PET useful in workup of early dementia patients? A study on typical patients clinically diagnosed Silverman DHS. Brain 18F-FDG PET in the Diagnosis of Neurodegenerative Dementia. JNM 2004; 45(4): 594-607.
FDG PET’s Utility in AD • Anatomic neuroimaging is routinely done in patients with MCI • Benefits of MRI & CT • Finds unsuspected structural lesions (5% of MCI patients) • Often, structural lesions are curable or treatable • Problems with MRI & CT • Too often read as “unremarkable” in AD patients • Cortical atrophy is non-specific (occurs with normal aging) • Ischemic insults lead clinicians to rule out AD, which could be concurrent Source: “Jack, Clifford R. (aging and dementia imaging).” Mayo Clinic. Accessed 9 May 2011. Silverman DHS. JNM 2004.
FDG PET’s Utility in AD • Clinical acumen lacking (even w/ MRI) • Correlation b/w clinical & postmortem dx in MCI patients at 7 specialized centers for AD studied (Victoroff J et al. Amer. J. Psych. 1995) • Only < 30% patients dx’d with “vascular dementia” alone (incorporating MRI) had isolated ischemic disease • > 70% had concurrent neurologic disease • More than 1 in 2 in the “vascular dementia only” group had true AD MRI demonstrates prominent deep white matter T2 hyperintensity with resultant central volume loss. There is no lobar atrophy, suggesting the dementia is likely due to multiple white matter infarcts. Source: “Multi-infarct dementia.” Radiopedia.org. Accessed 9 May 2011. Silverman DHS. JNM 2004.
FDG PET’s Utility in AD • Silverman’s team studied 170 MCI patients (~40% had depression, ~20% dx’d with hypothyroidism) • FDG PET correctly identified 99 patients of 109 who progressed to ND disease Sn 91% • Sn 91%, unaffected by MDD or ↓THism • Also correctly identified 49 of 61 who did not progress Sp 80%, but ↓ Sp if MDD or ↓THism (74%) Silverman DHS. JNM 2004.
FDG PET’s Utility in AD • Among MCI patients clinically dx’d as not having progressive dementia (followed 3 years) • If FDG PET positive (for ND dementia), patient 18X likelier to have progressive disease • If negative, patient 12X likelier to be cognitively stable • Neurologists correct 84% of time when dx’ing progressive dementia among this MCI group • Accuracy improved to 94% if positive PET scan Silverman DHS. JNM 2004.
FDG PET’s Utility in AD • In sum, Sn90+% of FDG PET detecting AD in both dementia & MCI patients • Sp~70% & Accuracy ~85% • ↓ FP of clinically dx’d AD & ↓ FN too • Negative FDG PET scan is most useful for MCI patients Source: Gonzalez RG and Johnson K. “Neuroimaging for Dementia and Alzheimer's Disease.” Mass. General Hospital. Updated 2006. Silverman DHS. JNM 2004.
Amyloid PET Future of Molecular Imaging in Alzheimer’s Disease