Download

1 / 35
350 likes | 507 Views
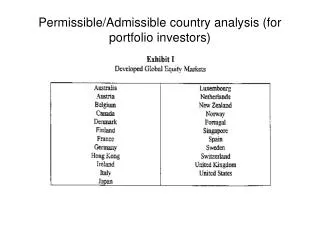
Technical Analysis for Investors. VP Goa Meet 2019.

E N D
Technical Analysis for Investors VP Goa Meet 2019
"Stocks do not sell for what they are worth but for what people think they are worth." How else can we explain that any market, stock, commodity, or currency can fluctuate a great deal in terms of its underlying value from one day to the next? Market prices are essentially a reflection of the hopes, fears, and expectations of the various participants.
Conflicting mindset creates confusion For long term investors, technical analysis can be used extremely effectively for the following: Better entry into a position Sell decisions Identify new stock ideas for research Understanding the underlying market dynamics even if no action is taken Technical Analysis works well when used as an overlay on fundamentals and not as a replacement. For long term wealth creation, Fundamental Analysis is 90% of the study. Always remember that both fundamental and technical studies are tools for analysis, not decision tools. They aid in the buy-sell decision making process.
Multiple patterns playing out on long term charts of Apollo Hospitals
Using basic supports & resistances • Support occurs where a downtrend is expected to pause, due to a concentration of demand. • Resistance occurs where an uptrend is expected to pause temporarily, due to a concentration of supply. • Market psychology plays a major role as traders and investors remember the past and react to changing conditions to anticipate future market movement.
Moving averages as trend indicators • A moving average (MA) is a widely used indicator in technical analysis that helps smooth out price action by filtering out the “noise” from random short-term price fluctuations. • It is a trend-following, or lagging, indicator because it is based on past prices. MA can be used to understand the overall trend of a stock or index. One can supplement one’s buying / selling after fundamental analysis based on the overall trend. For example, a long term investor may decide to add more to his holdings in a stock only when the price is near or below the a long term MA like 200 day moving average. It can also be a very useful profit booking strategy. Investors can plan to book profits if a stock breaches 200 day MA.
Moving averages can be effectively used for profit booking strategies • Sometimes, stocks rally beyond their fundamentals. • Selling based on valuations is one strategy but is not a very practical one from a wealth creation perspective as we don’t know the valuation the market is willing to give to a particular stock. • In such cases, sometimes a price trailing strategy works much better in terms of locking in higher profits. • It can also prevent catastrophic losses (like in Rain Industries / Graphite pack etc)
But is not foolproof because in volatile stocks, you can get whipsawed by following this strategy blindly
Many points to buy based on the chart of Bata • Once the fundamental study is done, just looking at the chart would give multiple points of entry. • A clearly visible Cup & Handle pattern • A golden crossover in April’17
Charts give a good entry point in Fairchem • Buy on golden crossover • Buy when the downward wedge (sloping channel) gets broken upwards • Next thing to watch is if/when stock price is able to break out of all time highs
Borosil – Should we risk buying it now? • Down trend is pronounced • Has broken previous low • If convinced about fundamentals, this is a good example of using technical analysis to possibly improve market timing
Avanti Feeds – Classical example of using moving averages • Selling on MA break could have protected investors • If convinced about fundamentals, stock price is giving a signal of an impending golden crossover, so should be on watchlist.