Download
1 / 44
440 likes | 508 Views
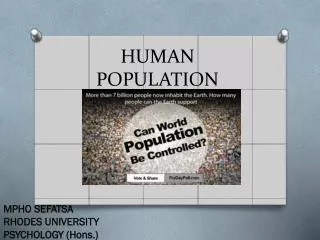
UNIT 5 HUMAN POPULATION. 5.1 DEMOGRAPHY. With the advent of the agricultural revolution in approximately 8,000 B.C., human culture changed from a hunting-gathering society to an increasing dependence on farming.

E N D
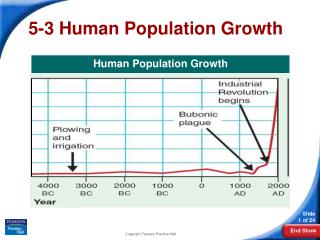
With the advent of the agricultural revolution • in approximately 8,000 B.C., human culture changed from a hunting-gathering society to an increasing dependence on farming. • It took almost 10,000 years for world population to reach the 1 billion mark as agriculture slowly improved the carrying capacity (K) of the land.
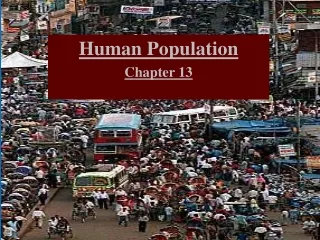
The largest increase in population has occurred since the beginning of the industrial revolution. • In less than 200 years, the population has gone from 1 billion to 6 billion. • World population continues to rise, even though the current growth rate of 1.55% has been declining since 1970, because the population base is so large.
Population increases are primarily due to a decline in death rates, rather than a rise in birth rates. • Demography is the study of population vital statistics. • Demographers have developed a hypothesis for population change called demographic transition.
Pre-industrial stage - high birth rates, high infant mortality, and high death rates resulting in low growth rates. • Transitional stage- industrialization begins and population increases dramatically; death rates drop while birth rates remain high. Many developing countries are in this stage.
Industrial stage - low birth and death rates with lower growth rates due to better education for women, birth control, and health care. Most developed nations are in this stage. • Post-industrial stage - birth rate equals or drops below death rate. • Most European countries have achieved ZPG. • Family planning is a necessary part of this demographic transition that includes choosing the number and the spacing of children.
Families must balance societal needs for lower population with traditional values and the need for family workers. • The age and number of females influences human population structure. • Half of the world’s 2.8 billion women are of child-bearing age.
Reducing births is related to literacy among women. A fundamental deterrent to ending poverty is that 1/4 of the world’s adults cannot read. • In many countries, birth rates are also influenced by cultural and religious beliefs. • If most of the population is pre-reproductive and/or reproductive age, the country has a high potential for growth.
China has the largest population, with India as the second largest. Together they make up 38% of world’s people. • The U. S. has the 3rd highest population, but it only makes up 5% of the world population. • However, resource usage is large.
Africa has the highest average population growth rate. The worldwide average fertility rate is 3 children per woman - 1.6 in developed countries and 3.4 in developing countries. • Although the world population growth rate is declining, the actual number of people is not. • This is due to exponential growth.
Can we determine the earth’s carrying capacity? It depends on the model, and it is difficult to determine the end point until it has been reached
The Riddle of the Doubling Lily Pads – by Garrett Hardin A farmer notices that lily pads are starting to choke his pond. He measures their growth and finds that they double every day. He estimates that they will cover his pond in one month (30 days) so he decides to cut them back when they cover half of the pond. What day does he need to cut them back?
He can wait until the 29th day. • This demonstrates how suddenly the carrying capacity can be reached. • Degradation would be easier to identify if it were always a gradual decline. • However, some ecosystems can handle multiple insults before the threshold is reached, and the populations crash.
Factors affecting death rate: • The greatest difference in population growth between humans and animals is the death rate. • Weak, sick and disabled animals are left to die or quickly succumb to predators. • Modern medicine is often able to “save” the most ill patient long enough for them to become parents. • Human birth defects are much higher than in other animal populations.
The factors affecting birth rates are: • education level, especially for women • Wealth • importance of a child as part of the labor force • urbanization - access to health services, prenatal care • cost of raising and educating children
employment opportunities for women • infant mortality • age at marriage - older women have fewer children • pension status to support older people • availability of birth control and legal abortions • religious and traditional customs
Life expectancy is an important indicator of a country’s quality of life, but infant mortality is the single most important measure. • The U.S. is 29th in infant mortality, and has the highest teenage pregnancy rate in the industrialized world • Half of teenage mothers go on welfare within a year - 77% in five years. • Single mothers and children account for 32% of America’s poor.
The following chart from the Population Reference Bureau gives the number of years required to add one billion people to the world population.
Date AchievedYears Required 1800 all human history First Billion Second 1930 130 Third 1960 30 Fourth 1974 14 Fifth 1987 13 Sixth 1998 11
The study of adverse chemical effects on health is called toxicology. • Toxicity is a measure of how harmful a substance is. • A poison or toxin is defined as the level at which a chemical kills 50% of the test populations in a single dose (LD50) within 14 days • Lethal doses (LD) are usually tested on rats.
Two factors affect toxicity: • dose - amount of exposure either single or accumulated • response - type of damage; temporary or permanent • The movement and distribution of toxins is influenced by a substance’s solubility, persistence, frequency, and biomagnification - the process of increasing toxins as they are passed through the food chain. • Dose-response curves are graphs of toxicity used to indicate whether a threshold level is needed to trigger a reaction - sometimes difficult to tell.
Risk assessment has these limitations: • Lab rats are different from humans • Test doses are extremely high to produce quicker (cheaper) data • Using case studies may not identify what other chemical exposures occurred or what habits a person has. • Testing may not show the effects of chemical interactions. • Testing may be too costly and slow to use on every chemical.
In the U.S., 99.5 % of the chemicals are entirely unregulated by federal and state governments. • Other health hazards include infectious diseases, injuries, • poor nutrition, and environmental stressors - overcrowding, poverty.
Prevention should be #1 choice in risk-management decisions. Yet worldwide, 10 million children die each year of preventable diseases. Only 5% of U.S. health care dollars is spent on prevention.
Toxic chemicals are grouped as: • Mutagens - alter chromosomes in adults ex: radiation • Teratogens - congenital defects; mother is fine but the fetus may be deformed or diseased • Carcinogens - known to cause cancer; • the #1 preventable death is from smoking. • Deaths from tobacco are 4 times higher than from car accidents, AIDS, homicides, alcohol or drug abuse.
neurotoxins - attack the nervous system • asphyxiates - interfere or exclude oxygen uptake • allergens - attack the immune system
Dioxin • Chemicals may also harm the endocrine systems. • Dioxin, a chlorinated hydrocarbon compound, is an example of a hormone disrupter. • According to the EPA, there is no safe level of dioxin. • It is difficult to test for hormone disruption. • Yet industry is permitted to discharge it into rivers as a result of chemical reactions from paper industry discharge. • Dose response curves tend to be U-shaped - high doses show no response because the hormone systems shut down.
Risk management is a protocol used to determine the probability of injury, disease, economic loss or environmental damage. • Risk-benefit analysis estimates potential dangers that drive capital expenditures. • System Reliability = technology x humans x 100
Often potential dangers are moved from the human side to the technology side, but what are the risks then? • No risk should be acceptable if it is avoidable. • People vary in their ability to perceive risks.
These factors increase perceived risk: • new or complex technology - new is seen as scary • involuntary activities - chemicals in air vs. smoking • unnecessary rather than useful - aspirin vs. vitamins • unfair distribution of risk - cancer vs. AIDS • publicity – plane crashes make the news; stomach flu doesn’t • lack of information - addictive drugs, side effects, alternatives
The goal of risk management should be to FIRST look for ways to prevent the problem. • One third of the world’s people are ill - mostly in developing countries. • 80% of all illnesses are caused by water borne diseases. Diarrhea is the leading cause of death in children. • In developing countries, 40% of the deaths are from infectious and parasitic diseases, compared to only 8% in developed nations.
In developed countries, there is 1 doctor for every 500 people - in E. Africa, there is 1 doctor for every 60,000 people. • Poor nations spend 75% of their health care dollars in cities, where only 25% of their people live. • We may be losing the war against infectious diseases. Many anti-biotic resistant strains of bacteria have developed. • As an example, a global tuberculosis epidemic is killing 3.1 million people per year.
Urban areas have populations over 2,500 people. Rural areas are below 2,500 residents. • The year 2000 was the first time in U.S. history that there were more people living in urban areas than in rural areas.
There are more than 290 cities with populations over 1 million. Spatial patterns of urban development include: • Concentric circle- a development model where growth leaves the inner-city core and radiates outward into suburbs.
Sector development - city grows in pie-shaped wedges or strips. • Multiple-nuclei - development around a number of independent centers or multi-level living.
Land Use Plans • Very few U.S. cities have comprehensive land-use plans although many cities are trying to develop them. • Comprehensive plans are unpopular because they result in some restriction of individual choices and property rights.
Comprehensive plans mandate green belts, open areas for recreation, where land must be “set aside”. • Urban sprawl is identified by comparing an area’s population increases with increases in land usage. • A environmentally friendly city plan emphasizes pollution prevention, reuse, recycling, efficient energy use, native trees and plants.
Environmental Pros of Urban living: • Residents have better access to education, jobs, services, entertainment and medical care. • Cities reduce destruction of wildlife habitat and protects biodiversity.
Environmental Cons of Urban living: • Higher concentration of pollutants and infectious disease • Aging infrastructures are more expensive to repair than to build new ones, and the tax base is smaller. • Higher crime rate in inner cities. • Increased traffic and over-crowding occurs in cities.