Download
1 / 48
480 likes | 486 Views
Climate Change: The Move to Action (AOSS 480 // NRE 480). Richard B. Rood Cell: 301-526-8572 2525 Space Research Building (North Campus) rbrood@umich.edu http://aoss.engin.umich.edu/people/rbrood Winter 2014 February 18, 2014. Class News. Ctools site: AOSS_SNRE_480_001_W14

E N D
Climate Change: The Move to Action(AOSS 480 // NRE 480) Richard B. Rood Cell: 301-526-8572 2525 Space Research Building (North Campus) rbrood@umich.edu http://aoss.engin.umich.edu/people/rbrood Winter 2014 February 18, 2014
Class News • Ctools site: AOSS_SNRE_480_001_W14 • Something I am playing with • http://openclimate.tumblr.com/ Politics of Dismissal Entry Uncertainty Description Model
Projects • Fracking (Omar, Jeffrey, Austin, Megan, Ranya) • With the recent technological advances in hydraulic fracturing, the U.S. has become the world’s largest producer of oil and is projected to become an exporter of natural gas. Natural gas has been posed as a “bridge fuel” to displace coal in the production of electricity, and to reduce the emissions of carbon dioxide. As a policy advisor on climate change, I need to know whether or not a transition to natural gas serves to reduce the emissions of greenhouse gases and the impact on water resources. I am especially concerned about the leakage of methane and huge amount of water that is required. I have another team working on public health effects air quality and water quality are out of your domain.
Projects • Agricultural (Edwin, Rachel, Kathleen, Chris) • The accounting of greenhouse gas emissions from agriculture is difficult. I have read that something like 30% of the total emissions are agriculturally related. This requires that those emissions used in, say, fertilizer manufacturing are accounted in agriculture rather than industry. Recently, I read a blog http://www.wunderground.com/blog/RickyRood/greenhouse-emissions-of-agriculture that said there was one group who claimed all by itself, livestock was responsible for more than 52% of the emissions. This seems enormous and challenges many conventional strategies for greenhouse gas management. The CEO of my company has announced a sustainability effort, and I want to know what decisions my food manager can make the matter to climate change, including water resources. Should I emphasize vegetarian meals, or is it better to buy local, “sustainable,” or organic?
Projects • Air Travel (Meng, Arnav, Mason, John, Justin) • There is no doubt that airplanes emit carbon dioxide and other greenhouse gases. Air travel is an important part of the economy. When I read about air travel and climate impacts, the information is complicated. Often the discussion ends with the admission that there are not obvious options to make air travel and transport “sustainable” in the sense of climate change. The European Union has been considering a way to reduce emissions from air travel. Their efforts have only revealed even more complexity in reducing the environmental impact of aircraft. In order to know how much priority to give to sustainable air travel in my research and development portfolio, I need a knowledge-based assessment of the impact of air travel on climate, risks associated with “doing nothing” and the viable strategies for making air travel “sustainable.”
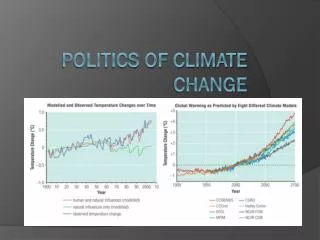
Today • Scientific investigation of the Earth’s climate: Foundational information • Changes in Forcing • “Internal Variability” • In Class Exercise: Response • It hasn't warmed since 1998: For the years 1998-2005, temperature did not increase. This period coincides with society's continued pumping of more CO2 into the atmosphere.
Let’s start with this figure • We arrived at this rather complex figure at the end of the previous lecture
1998 Climate Forcing (-2.7, -0.6) 2001 (-3.7, 0.0) Hansen et al: (1998) & (2001)
Today • Scientific investigation of the Earth’s climate: Foundational information • Changes in Forcing • “Internal Variability” • In Class Exercise: Response • It hasn't warmed since 1998: For the years 1998-2005, temperature did not increase. This period coincides with society's continued pumping of more CO2 into the atmosphere.
Let’s look at just the last 1000 years Surface temperature and CO2 data from the past 1000 years. Temperature is a northern hemisphere average. Temperature from several types of measurements are consistent in temporal behavior. { Note that on this scale, with more time resolution, that the fluctuations in temperature and the fluctuations in CO2 do not match as obviously as in the long, 350,000 year, record. This is a span of time with very “stable” climate, by historical records. Stable meaning, low variability. Also it has been warm.
Sources of internal variability • There is “natural” variability. • Solar variability • Volcanic activity • Internal “dynamics” • Atmosphere - Weather • Ocean • Atmosphere-ocean interactions • Atmosphere-ocean-land-ice interactions • “Natural” does not mean that these modes of variability remain constant as the climate changes. Separation of “natural” and “human-caused.”
Energy doesn’t just come and go • The atmosphere and ocean are fluids. The horizontal distribution of energy, causes these fluids to move. That is “weather” and ocean currents and the “general circulation.” • “General circulation” is the accumulated effect of individual events.
Transport of heat poleward by atmosphere and oceans • This is an important part of the climate system • One could stand back far enough in space, average over time, and perhaps average this away. • This is, however, weather ... and weather is how we feel the climate day to day • It is likely to change because we are changing the distribution of average heating
Some Aspects of Climate Variability • One of the ways to think about climate variability is to think about persistent patterns of weather • Rainy periods • Floods • Dry periods • Droughts • During these times the weather for a region does not appear random – it perhaps appears relentless
An example of variability: Seasons Warm Cold Cold Temperature Messy Messy Winter Summer Winter Rain comes in thunderstorms Rain comes in fronts Forced variability responding to solar heating
Internal Variability? • Weather – single “events” – waves, vortices • There are modes of internal variability in the climate system which cause global changes. • El Nino – La Nina • What is El Nino • North Atlantic Oscillation • Climate Prediction Center: North Atlantic Oscillation • Annular Mode • Inter-decadal Tropical Atlantic • Pacific Decadal Oscillation
Times series of El Nino (NOAA CPC) EL NINO LA NINA OCEAN TEMPERATURE EASTERN PACIFIC ATMOSPHERIC PRESSURE DIFFERENCE
Some good El Nino Information • NOAA Climate Prediction: Current El Nino / La Nina • NOAA CPC: Excellent slides on El Nino • This is a hard to get to educational tour. This gets you in the middle and note navigation buttons on the bottom.
GISS Temperature 2002 1997-98 El Nino
Internal Variability? • Weather – single “events” – waves, vortices • There are modes of internal variability in the climate system which cause global changes. • El Nino – La Nina • What is El Nino • North Atlantic Oscillation • Climate Prediction Center: North Atlantic Oscillation • Annular Mode • Inter-decadal Tropical Atlantic • Pacific Decadal Oscillation
North Atlantic Oscillation Negative Phase U.S. East, Cold Air Outbreaks, Snow (dry) Europe North, Cold; South, Wet Greenland, Warm Positive Phase U.S. East, Mild and Wet Europe North, Warm and Wet Canada North & Greenland, Cold and Dry
North Atlantic Oscillation Phase(from Climate Prediction Center)
Year-to-Year Changes in Winter Temperatures Differences Relative to 1961-1990 Average Late 1970s 2006-2011 From Jim Hurrell
Internal Variability? • Weather – single “events” – waves, vortices • There are modes of internal variability in the climate system which cause global changes. • El Nino – La Nina • What is El Nino • North Atlantic Oscillation • Climate Prediction Center: North Atlantic Oscillation • Annular Mode • Inter-decadal Tropical Atlantic • Pacific Decadal Oscillation
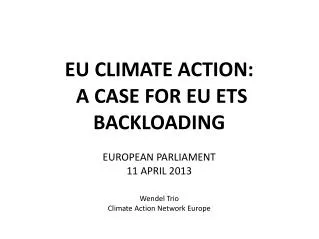
Pacific Decadal Oscillation • Does the Pacific Decadal Oscillation operate regularly lasting 20-30 years, and does southern California experience droughts during that period? • The Pacific Decadal Oscillation is one of several “oscillations” that are important to weather and climate. • Some attributes of the Pacific Decadal Oscillation
Pacific Decadal Oscillation: Basics Colors: Sea Surface Temperature difference from long term average. Arrows: Stress on the ocean surface caused by winds Cool here Warm here Better version of figure from JISAO
Some information on Pacific Decadal Oscillation • Joint Institute for Study of Atmosphere and Ocean (JISAO): • Pacific Decadal Oscillation • Climate Prediction Center (CPC): • 90 Day Outlook Summary • Weather and Climate Linkage • National Climatic Data Center (NCDC): • Decadal Oscillations • Review Paper from Rood Class References • Mantua and Hare (2002) J of Oceanography
Bumps and Wiggles • Rood’s Series on Bumps and Wiggles
Today • Scientific investigation of the Earth’s climate: Foundational information • Changes in Forcing • “Internal Variability” • In Class Exercise: Response • It hasn't warmed since 1998: For the years 1998-2014, temperature did not increase. This period coincides with society's continued pumping of more CO2 into the atmosphere.
An interesting time to study? GISS Temperature 2002 1997-98 El Nino
In Class Exercise • Economist: • Temperature not going up, but carbon dioxide is. Look! Warming has stopped.
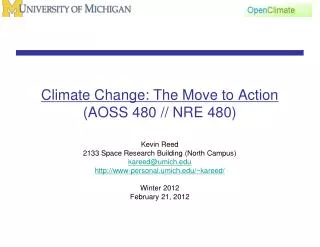
Scientific investigation of Earth’s climate SUN: ENERGY, HEAT EARTH: ABSORBS ENERGY EARTH: EMITS ENERGY TO SPACE BALANCE
Sun-Earth System in Balance SUN EARTH PLACE AN INSULATING BLANKET AROUND EARTH The addition to the blanket is CO2 FOCUS ON WHAT IS HAPPENING AT THE SURFACE EARTH: EMITS ENERGY TO SPACE BALANCE
Increase of Atmospheric Carbon Dioxide (CO2) Primary increase comes from burning fossil fuels – coal, oil, natural gas Data and more information
Medieval warm period • “Little ice age” • Temperature starts to follow CO2 as CO2 increases beyond approximately 300 ppm, the value seen in the previous graph as the upper range of variability in the past 350,000 years. Temperature and CO2: The last 1000 years Surface temperature and CO2 data from the past 1000 years. Temperature is a northern hemisphere average. Temperature from several types of measurements are consistent in temporal behavior.
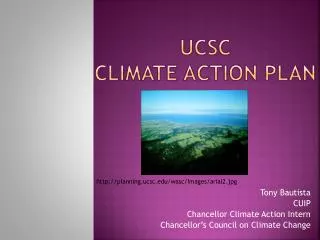
CLOUD-WORLD The Earth System SUN ATMOSPHERE OCEAN ICE (cryosphere) LAND
1998 Climate Forcing (-2.7, -0.6) 2001 (-3.7, 0.0) Hansen et al: (1998) & (2001)