Download
1 / 8
80 likes | 107 Views
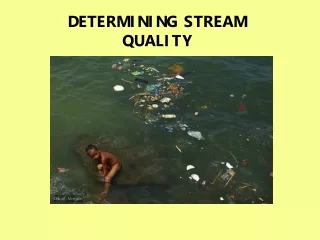
Explore nutrient pollution impact on stream ecosystems, leveraging existing data sets to develop vocabularies for data representation and interoperability. Focus on water quality, biological indicators, & habitat characteristics. EPA & USGS data integrated. -

E N D
Water Quality in a Stream Reach SOCoP 2012 Workshop Topic Gary Berg-Cross Nov. 29-30, 2012 U. S. Geological Survey National Center 12201 Sunrise Valley Dr., Reston VA
Originations of Topic • The idea of Stream ecosystem "site" & water quality (structure and function) emerged from conversations at the Research Data Alliance workshop (rd-alliance.org) in Ballston VA 9/12 • Brian Wee, Gary Berg-Cross (Bob Chen Columbia) • This “scenario topic is based in part by work inspired by Neon Educational System for Data Access and Analysis involving Dennis Ward ( educational technologist with NEON Inc.), and the RPI team, • investigated how nutrient pollution impact stream ecosystems locally & nationally. • That was educationally oriented • SOCoP workshop would be directed more at modeling the situation to support data representation and interoperability across the various data sets (TBD) involved. • Note: Related to ideas of streams as container of surface water (studied by Torsten Hahmann & Boyan Brodaric) which might serve as foundation. • Torsten Hahmann, Boyan Brodaric: The Void in Hydro Ontology. FOIS 2012: 45-58
Strategy • As time permitted Brian’s would work on Stream-Environmental-Ecology Health Scenario with observations • Example, might have a EPA water quality observations which may overlap with the geo-region defined by a stream reach • Idea was to explore lightweight approach that might develop relevant vocabularies that can be modeled and formalized • Leverage existing work such as RPI effort participated in by Brian Wee and James Wilson • Leverage EPA models of water quality parameters as well as • related USGS stream gage data, • NEON aquatic measurement data, and • EPA models • hopefully this might be of interest to a good cross section of folks.
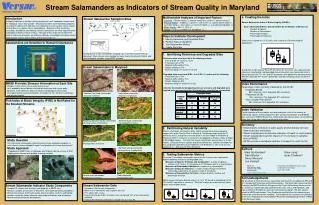
Scenario: Water quality might define a starting focus. • EPA, for example, might collect organic content of streams. • USGS has relevant data too on water quality and from stream gauges and these might be integrated. • Relevant Concepts then might include the concepts of Ecological Content identified as part of that work is Stream ecosystem structure and function along with such related ideas as: • Water quality and water integrity indicators, : http://water.usgs.gov/nawqa/ • organic nutrients at point X and 50 feet down from X, • biological indicators, • Water chemistry, • habitat and watershed characteristics can affect macroinvertebrate populations. • The U.S. Environmental Protection Agency has published data on a number of these pollutants, and the information can generally be found at http://www.epa.gov. • macroinvertebrate index • EPA barcoding: for DNA analysis of critters found in the stream
Stream Reach: Natural Aggregation into Water System Platt? Part of
Start on Modeling Situation Similar/uniform Characteristics streamReach hasProperty, uniform Monitoring Reach Point R 101 Reach Point R 102 Void of water
RPI Model Work http://tw.rpi.edu/web/project/NESDAA/Use_Cases/
Propositions from NEON NESDAA Stream Ecosystem Health Model • Stream partOf Watershed • Stream hasSamplingSite • SamplingSite hasMeasurement Indicator, • Stream has EcosystemHealth • Biodiversity part of EcosystemHealth • Stream IsA gml:Feature, • ChangesInBiodiversity is a Change • Watershed hasStream Stream, • EPT is a Indicator, • USGSNNNNNN is a SamplingSite, • Eutrophication is a ProblemArea, • ProblemArea isAssessedUsing Indicator