Download
1 / 8
80 likes | 85 Views
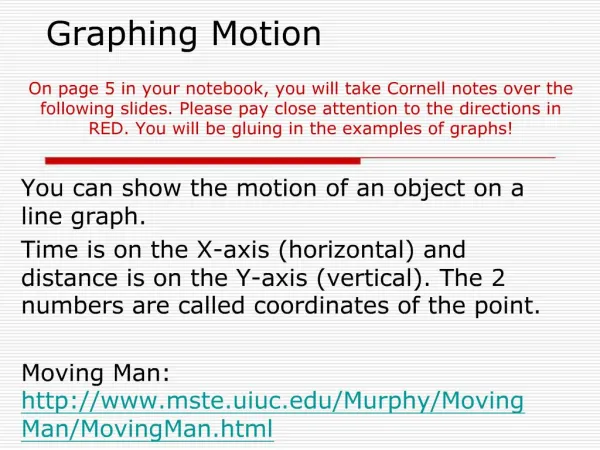
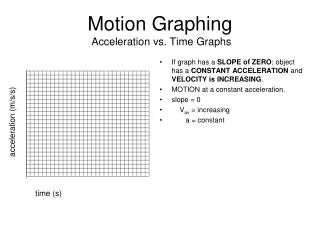
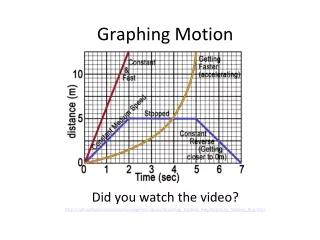
I. Graphing Motion. Can be shown on a line graph Plot distance against time Time: horizontal axis, x-axis (across) Distance: vertical axis, y-axis (up and down). I. Graphing Motion. B.) A point on the graph represents the location of an object at a particular time. II. Slope of a line .

E N D
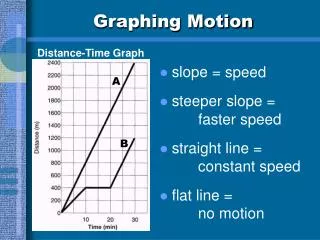
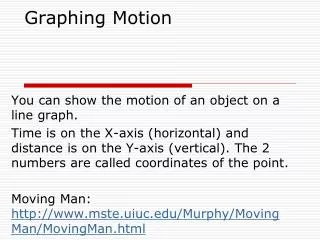
I. Graphing Motion • Can be shown on a line graph • Plot distance against time • Time: horizontal axis, x-axis (across) • Distance: vertical axis, y-axis (up and down)
I. Graphing Motion B.) A point on the graph represents the location of an object at a particular time.
II. Slope of a line • The steepness or slant of a line on a graph. • Tells how fast one variable changes in relation to the other variable. (rate of change)
II. Slope of a line C.) Since speed is the rate of change of distance in relation to time, the slope of a distance-time graph represents speed.
II. Slope of a line D.) The faster the motion, the steeper the slope E.) A constant slope represents motion at a constant speed.
III. Calculating slope • The slope of a line is its rise divided by its run. • Rise is the vertical difference between 2 points
III. Calculating slope C.) Run is the horizontal difference between 2 points. D.) Slope = rise / run