Download

1 / 21
210 likes | 287 Views
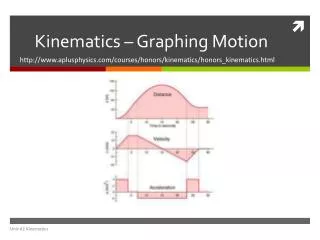
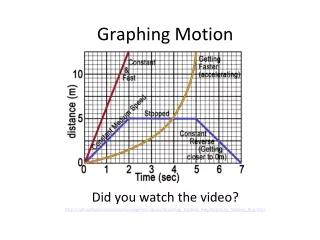
Graphing Motion. Equations are not the only way to go. We can often use graphs to quickly get a sense of what is happening as an object moves: Where is the object, and when. How fast is it moving and in what direction. By how much did it change it’s position.

E N D
Equations are not the only way to go. • We can often use graphs to quickly get a sense of what is happening as an object moves: • Where is the object, and when. • How fast is it moving and in what direction. • By how much did it change it’s position. • What’s the object’s acceleration. • Making and analyzing graphs is a cool skill, necessary for every burgeoning junior physicist.
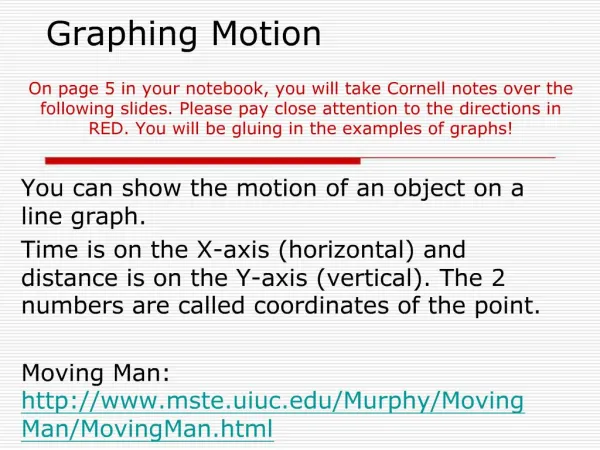
Consider the following data for a student walking to school. Plot the points on a graph with position (x) on the vertical axis, and time (t) on the horizontal axis. This is a position-vs-time graph, also known as a position graph, or an x-vs-t graph.
Important! The graph does not show the object’s trajectory. Remember, the object is moving along the x- axis.
Where did the object start? • In what direction did the object start moving? • At what time did the object cross the origin? • When was the object 5 m left of the origin? • How fast was the object moving at t = 35 s? • What total distance did the object cover? • What was the object’s average speed for the whole trip? • What was the object’s total displacement? • What was the object’s average velocity for the whole trip? x (m) t (s)
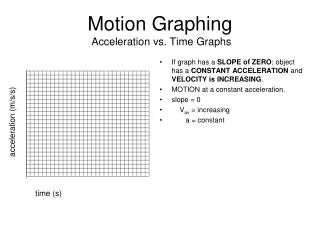
What was the object’s velocity for 0 < t < 2 s? What was the object’s velocity for 2 < t < 4 s? What was the object’s velocity for 4 < t < 6 s?
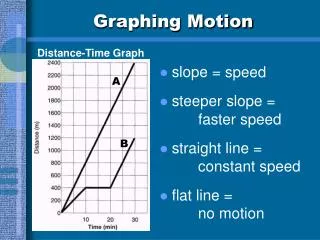
To go from a position graph to a velocity graph: Find the slopes… Then plot the slope values.
Constant Acceleration On a position graph, constant acceleration is always a parabola.
Average velocity for any time interval is the slope of the secant line over that time. Finding vavg from t= .75 s to t = 1.5 s Secant line
Instantaneous velocity at a particular time is the slope of the tangent line at that time. Finding v at t = .75 s Tangent line
Slope = instantaneous velocity Tangent line Secant line Slope = average velocity
Displacement is the area under the velocity-vs-time graph.
c c