Download
1 / 39
390 likes | 576 Views
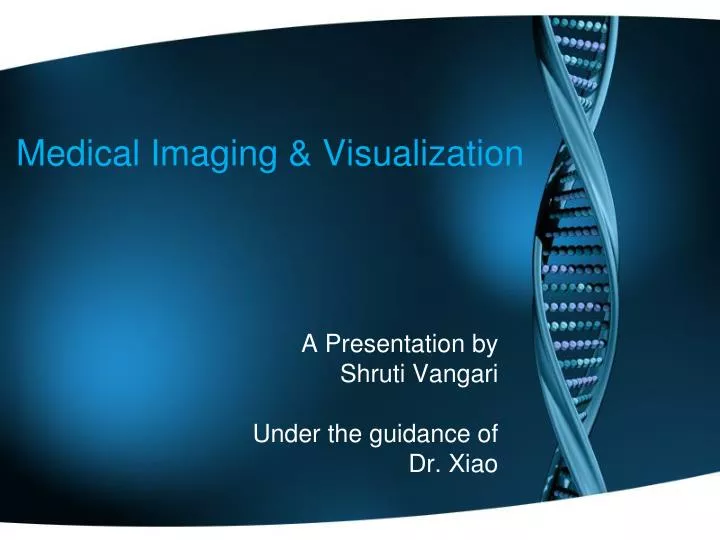
Medical Imaging & Visualization. A Presentation by Shruti Vangari Under the guidance of Dr. Xiao. Outline of this project. Aim : To help doctors diagnose cancer faster Data used : Collection of brain samples of patients detected with cancer

E N D
Medical Imaging & Visualization A Presentation byShruti VangariUnder the guidance ofDr. Xiao
Outline of this project • Aim: To help doctors diagnose cancer faster • Data used : Collection of brain samples of patients detected with cancer • Idea : Filtering of edges of these medical images can help fasten the process of detecting tumor • Algorithm: Canny Edge Detection
Terminology • Medical Imaging: • Process to create images of the human body for clinical purposes • Visualization: • Representing information as Computer Graphics • VTK(Visualization toolkit) and ITK(Insight Segmentation and Registration Toolkit) : • Computer graphics, image processing & visualization
Medical Terminology • Nuclear Medicine (NM): • Application of radioactive elements – radiopharmaceuticals in the diagnosis and treatment of disease • Medical Resonance Imaging (MR): • Medical technique used in radiology to visualize internal structures of the body
Steps followed – Step 1 • Step 1 – Collect Samples • MR and NM samples of the following time periods: • Baseline • Baseline + 2 months • Baseline + 4 months • Baseline + 7 months • Baseline + 10 months • Baseline + 12 months • Baseline + 15 months • Baseline + 17 months • Baseline + 21 months • Baseline + 25 months
Steps followed – Step 2 • Step 2 – Setup the system and software • Download Cmake • Download VTK • Download VTK data • Download ITK Insight Applications • Download ITK Insight Toolkit • Build all the software as per the steps • Write a sample program to build the binaries
Steps Followed – Step 3 • Step 3 - Canny Edge detection Algorithm • Gaussian filter – to smoothen image & reduce noise • Gradient Magnitudes – Gradient vector of an image • Non-Max suppression – Sets to 0 if pixel is not a peak • Canny Output Edges – Got after thresholding and linking the edges
Steps followed – Step 4 Step 4 – Canny Edge Detection in VTK "vtkSmartPointer.h" "vtkDICOMImageReader.h" "vtkImageGaussianSmooth.h" "vtkImageActor.h" "vtkRenderer.h" "vtkRenderWindow.h" "vtkRenderWindowInteractor.h" "vtkImageGradient.h" "vtkImageMagnitude.h" vtkImageNonMaximumSuppression.h" "vtkImageConstantPad.h" "vtkImageToStructuredPoints.h" "vtkLinkEdgels.h" "vtkThreshold.h" "vtkGeometryFilter.h" "vtkSubPixelPositionEdgels.h" "vtkStripper.h" "vtkPolyDataMapper.h" "vtkJPEGReader.h" "vtkTextProperty.h" "vtkTextActor.h"
Input Data Used MR Data Saggital Axial Coronal
Canny Edge Detection - Output Gaussian Smoothed Canny Edges Gradient Magnitudes Non-Max Suppression
Other image filtering - NM NM Data Input NM Data Canny Edges
Comparison of the outputs • The outputs were compared from the baseline period till baseline + 25 months • The results showed a dramatic improvement – base on the medication
ITK Output - Baseline
Conclusion • The Canny Edge Detection algorithm uses a multi-stage algorithm to detect edges in images. • It finds “optimal” edges implying • Good Detection • Good Localization • Minimal Response • Hence, one gets accurate results. The same was proved in his paper as well – cited in the references
Future Work • Use the concept of FUSION – MR + NM • Detect edges for the fused image – faster and more accurate results • To find edges for all the data collected : Baseline to Baseline + 25 months.
References • Visualization slides prepared by Dr. Xiao http://cs.uakron.edu/~xiao/ • Wikipedia, the free encyclopedia http://www.wikipedia.org/ • VTK Kitwarehttp://www.vtk.org/ • ITK Kitwarehttp://www.itk.org/ • CmakeKitwarehttp://www.cmake.org/ • Cancer data samples collected from https://public.cancerimagingarchive.net/ncia/home.jsf
References (2) • Canny Edge Detection http://www.cse.iitd.ernet.in/~pkalra/csl783/canny.pdf • Image Processing Algorithms • J Canny. 1986. A Computational Approach to Edge Detection. IEEE Trans. Pattern Anal. Mach. Intell. 8, 6 (June 1986), 679-698. DOI=10.1109/TPAMI.1986.4767851 http://dx.doi.org/10.1109/TPAMI.1986.4767851