Download
1 / 36
360 likes | 419 Views
Partnering with Local Programs to Interpret and Use Outcomes Data. Delaware’s Part B 619 Program September 20, 2011 Verna Thompson & Tony Ruggiero Delaware Department of Education Early Development and Learning Resources. Agenda. Delaware Information Demographics State COSF Data

E N D
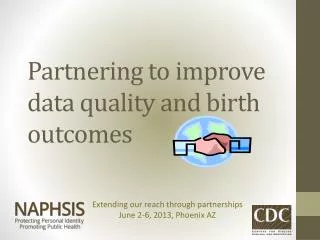
Partnering with Local Programs to Interpret and Use Outcomes Data Delaware’s Part B 619 Program September 20, 2011 Verna Thompson & Tony Ruggiero Delaware Department of Education Early Development and Learning Resources
Agenda • Delaware Information • Demographics • State COSF Data • 2011 Part B 619 Local Program Visits • Purpose of visits • Information shared • What we learned • Data Analysis Process • Distribution by disability type and year • Possible explanations for unusual data • Improving Child Outcome Data • Plans for improving data quality
Delaware Demographics • Geography • 1949.20 square miles • Three Counties • 19 school districts • Population • 897,934 people (2010 US Census) • Children • 17% of young children 0-5 live in poverty (Center for Applied Demography and Survey Research, University of Delaware) • 1,551 children with disabilities (3-5 years old) in Part B 619 (Delaware Department of Education)
Delaware Young Children in619 Child Outcomes System • Children 3-5 years of age with IEP • Children receiving at least 6 months of services • 6 months between the first and final assessment • Children who temporarily withdraw from services are included if they return within 30 days of the date they withdrew • Children with more than 30 day break in service are considered dropped from the program. If the child re-enrolls the 60 day assessment process must be initiated again.
Procedures for COSF Process Child Outcomes procedures are available in Building BLOCKS Manual • Multidisciplinary teams complete COSF with parent input • COSF information is entered on state data system • COSF data is downloaded by Delaware DOE EDLR
Outcome 1: Positive Social Relationships (DE 2010, Social and Emotional) 11
Outcome 2: Use Knowledge and Skills (DE 2010, Knowledge and Skills) 12
Outcome 3: Appropriate Action (DE 2010, Behavior Meets Needs) 13
Part B 619 Site Visits • Purpose of visits • Develop relationships with 619 coordinators • Gather information about 619 programs • Share Child Outcomes information • Discuss COSF process in the district • Begin the data analysis process with district • Determine strengths and needs for support
Part B 619 Site Visits • Procedure for Site Visits • District shared information • Early Childhood program and children • Child Outcomes procedures • DOE shared information • Delaware Child Outcomes data • State Child Outcomes targets • School district Child Outcomes data • Analyzed data together • Compared state and local data • Explored possible local trends, patterns • Discussed next steps
Outcome 1: Positive Social Relationships (District A 2010, Social and Emotional) 19
Part B 619 Site Visits • What we learned – successes and challenges • Some children were not being included in Child Outcomes System • School districts had unique rating patterns • School districts assigned different staff to enter COSF ratings on data system • Progress question was not answered in consistent manner • Many special services directors had limited understanding of COSF process
After Completing Site Visits…… • School Districts • Requested training for EC staff • Discussed COSF process during staff meetings • Called DOE often to discuss unusual data • Special Services shared COSF data with administrators • DOE EDLR • Participated in updating Child Outcomes manual • Continued analysis process
Child Outcomes Data Analysis Process • Activity: • Analyze entry and exit Child Outcomes data from 3 school districts • Do you notice any differences between the districts and the state Child Outcomes data?
Delaware and District Data • Explanations for differences • Programs serve different populations of children • Small numbers issues exist in some districts • Population shift of students who are assessed • Scores differ by special education type • Different levels of EC staff experience using COSF
Population of Young Children With DisabilitiesDelaware 2008-2010
Population of Young Children With DisabilitiesDelaware & Selected Districts 2010
OSEP APR Indicator 7 a Percent of preschool children who did not improve functioning b Percent of preschool children who improved functioning but not sufficient to move nearer to functioning comparable to same-aged peers c Percent of preschool children who improved functioning to a level nearer to same-aged peers d Percent of preschool children who improved functioning to reach a level comparable to same-aged peers e Percent of preschool children who maintained functioning at a level comparable to same-aged peers
OSEP APR Indicator 7 Summary Statement Data 1. Of those children who entered or exited the program below age expectations the percent who substantially increased their rate of growth by the time they exited the program. 2, The percent of children who were functioning within age expectations by the time they exited the program.
What are we planning to improve Child Outcome data? • New process for working with school districts to review Child Outcomes data • Revised Child Outcomes manual • Identify missing children who are not being entered in system • Communicate the COSF Process Provide ongoing training for completing COSF using multi-sources of information • Question unusual data • Troubleshoot problems
How can we improve ChildOutcome data? • Provide professional development opportunities with Part B and C • Analyze teaming procedures for completing COSF using multi-sources of information • Encourage school districts to discuss and practice COSF process at staff meetings
Questions, comments? • Opportunity to share comments, experiences….. • Questions? Thank you! vthompson@doe.k12.de.us truggiero@doe.k12.de.us