Download
1 / 32
330 likes | 354 Views
Chapter 17 Factorial Analysis of Variance. Fundamental Statistics for the Behavioral Sciences, 5th edition David C. Howell. © 2003 Brooks/Cole Publishing Company/ITP . Major Points. What is a factorial design? An example Main effects Interactions Simple effects. Cont.

E N D
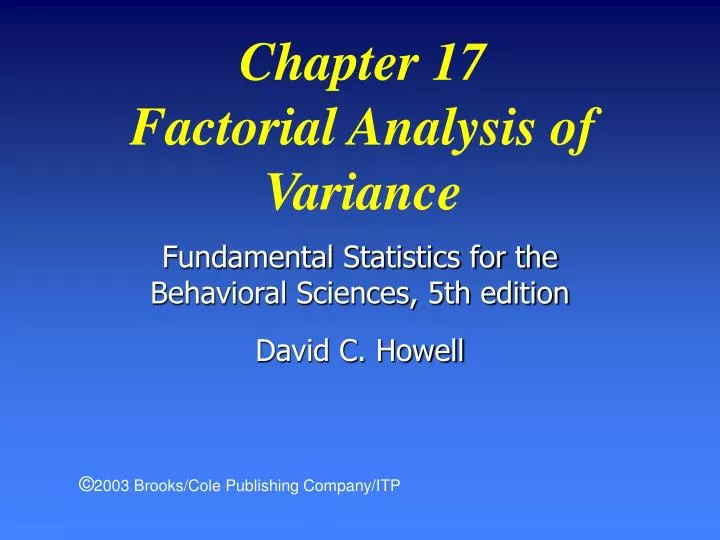
Chapter 17 Factorial Analysis of Variance Fundamental Statistics for the Behavioral Sciences, 5th edition David C. Howell ©2003 Brooks/Cole Publishing Company/ITP
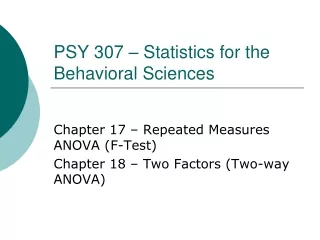
Chapter 17 Factorial Analysis of Variance Major Points • What is a factorial design? • An example • Main effects • Interactions • Simple effects Cont.
Chapter 17 Factorial Analysis of Variance Major Points-cont. • Unequal sample sizes • Magnitude of effect • Review questions
Chapter 17 Factorial Analysis of Variance What is a Factorial • At least two independent variables • All combinations of each variable • R X C factorial • Cells
Chapter 17 Factorial Analysis of Variance Video Violence • Bushman study • Two independent variables • Two kinds of videos • Male and female subjects • See following diagram
Chapter 17 Factorial Analysis of Variance 2 X 2 Factorial
Chapter 17 Factorial Analysis of Variance Bushman’s Study-cont. • Dependent variable = number of aggessive associates • 50 observations in each cell • We will work with means and st. dev., instead of raw data. • This illustrates important concepts.
Chapter 17 Factorial Analysis of Variance The Data (cell means and standard deviations)
Chapter 17 Factorial Analysis of Variance Plotting Results
Chapter 17 Factorial Analysis of Variance Effects to be estimated • Differences due to videos • Violent appear greater than nonviolent • Differences due to gender • Males appear higher than females • Interaction of video and gender • What is an interaction? • Does violence affect males and females equally? Cont.
Chapter 17 Factorial Analysis of Variance Estimated Effects--cont. • Error • average within-cell variance • Sum of squares and mean squares • Extension of the same concepts in the one-way
Chapter 17 Factorial Analysis of Variance Calculations • Total sum of squares • Main effect sum of squares Cont.
Chapter 17 Factorial Analysis of Variance Calculations--cont. • Interaction sum of squares • Calculate SScells and subtract SSV and SSG • SSerror = SStotal - SScells • or, MSerror can be found as average of cell variances
Chapter 17 Factorial Analysis of Variance Degrees of Freedom • df for main effects = number of levels - 1 • df for interaction = product of dfmain effects • dferror = N - ab = N - # cells • dftotal = N - 1
Chapter 17 Factorial Analysis of Variance Calculations for Bushman Data • SStotal requires raw data. • It is actually = 171.50 • SSvideo Cont.
Chapter 17 Factorial Analysis of Variance Calculations--cont. • SSgender Cont.
Chapter 17 Factorial Analysis of Variance Calculations--cont. • SScells • SSVXG = SScells - SSvideo - SSgender= 171.375 - 105.125 - 66.125 = 0.125 Cont.
Chapter 17 Factorial Analysis of Variance Calculations--cont. • MSerror = average of cell variances =(4.62 + 3.52 + 4.22 + 2.82)/4 =58.89/4 = 14.723 • Note that this is MSerror and not SSerror
Chapter 17 Factorial Analysis of Variance Summary Table
Chapter 17 Factorial Analysis of Variance Conclusions • Main effects • Significant difference due to video • More aggressive associates following violent video • Significant difference due to gender • Males have more aggressive associates than females. Cont.
Chapter 17 Factorial Analysis of Variance Conclusions--cont. • Interaction • No interaction between video and gender • Difference between violent and nonviolent video is the same for males (1.5) as it is for females (1.4) • We could see this in the graph of the data.
Chapter 17 Factorial Analysis of Variance Elaborate on Interactions • Diagrammed on next slide as line graph • Note parallelism of lines • Means video differences did not depend on gender • A significant interaction would have nonparallel lines • Ordinal and disordinal interactions
Chapter 17 Factorial Analysis of Variance Line Graph of Interaction
Chapter 17 Factorial Analysis of Variance Simple Effects • Effect of one independent variable at one level of the other. • e.g. Difference between males and females for only violent video • Difference between males and females for only nonviolent video
Chapter 17 Factorial Analysis of Variance Unequal Sample Sizes • A serious problem for hand calculations • Can be computed easily using computer software • Can make the interpretation difficult • Depends, in part, on why the data are missing.
Chapter 17 Factorial Analysis of Variance Magnitude of Effect • Eta Squared • Interpretation • Omega squared • Less biased estimate k = number of levels for the effect in question Cont.
Chapter 17 Factorial Analysis of Variance Effect Size—cont. • As with one-way, we can calculate effect size for each kind of effect separately. • Most sensible to stick to comparisons of two groups. • Same formulae as for t tests.
Analysis of Variance for AGGASSOC Source DF SS MS F P GENDER 1 66.1 66.1 4.49 0.035 VIDEO 1 105.1 105.1 7.14 0.008 Interaction 1 0.1 0.1 0.01 0.927 Error 196 2885.6 14.7 Total 199 3057.0 Chapter 17 Factorial Analysis of Variance Minitab Example Cont.
Chapter 17 Factorial Analysis of Variance Minitab--cont. Individual 95% CI GENDER Mean --------+---------+---------+---------+--- 1 6.95 (----------*----------) 2 5.80 (----------*----------) --------+---------+---------+---------+--- 5.60 6.30 7.00 7.70 Individual 95% CI VIDEO Mean ---------+---------+---------+---------+-- 1 7.10 (---------*--------) 2 5.65 (---------*--------) ---------+---------+---------+---------+-- 5.60 6.40 7.20 8.00
Chapter 17 Factorial Analysis of Variance Review Questions • What is the definition of a factorial design? • How many independent variables can you have in a factorial design? • How many levels of an independent variable can you have? Cont.
Chapter 17 Factorial Analysis of Variance Review Questions--cont. • What do all of the calculations for sums of squares have in common? • How does a main effect differ from an interaction? • How does a main effect differ from a simple effect? Cont.
Chapter 17 Factorial Analysis of Variance Review Questions--cont. • Give an example of a situation where you would commonly expect an interaction. • What happens to F values when MSerror decreases? • How do eta-squared and omega-squared differ?