Download
1 / 6
100 likes | 247 Views
Discrete and Continuous Random Variables. Random Variable and Probability Distribution A probability model describes the possible outcomes of a chance process and the likelihood that those outcomes will occur.

E N D
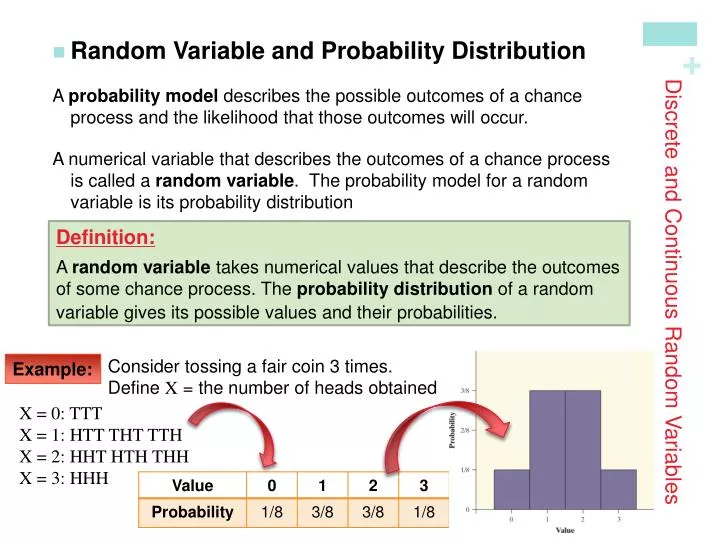
Discrete and Continuous Random Variables • Random Variable and Probability Distribution A probability model describes the possible outcomes of a chance process and the likelihood that those outcomes will occur. A numerical variable that describes the outcomes of a chance process is called a random variable. The probability model for a random variable is its probability distribution Definition: A random variable takes numerical values that describe the outcomes of some chance process. The probability distribution of a random variable gives its possible values and their probabilities. Consider tossing a fair coin 3 times. Define X = the number of heads obtained Example: X = 0: TTT X = 1: HTT THT TTH X = 2: HHT HTH THH X = 3: HHH
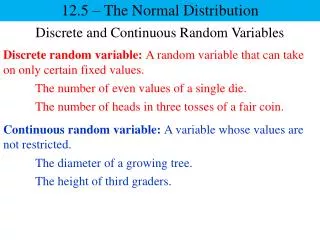
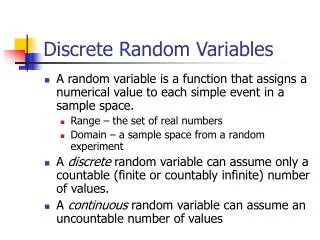
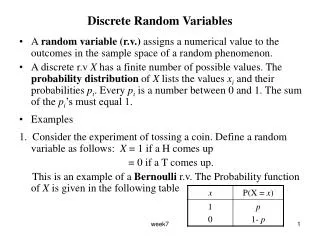
Discrete and Continuous Random Variables • Discrete Random Variables There are two main types of random variables: discrete and continuous. If we can find a way to list all possible outcomes for a random variable and assign probabilities to each one, we have a discrete random variable. Discrete Random Variables and Their Probability Distributions • A discrete random variableX takes a fixed set of possible values with gaps between. The probability distribution of a discrete random variable X lists the values xiand their probabilities pi: • Value: x1x2x3 … • Probability: p1p2p3 … • The probabilities pi must satisfy two requirements: • Every probability piis a number between 0 and 1. • The sum of the probabilities is 1. • To find the probability of any event, add the probabilities piof the particular values xithat make up the event.
Discrete and Continuous Random Variables • Mean of a Discrete Random Variable When analyzing discrete random variables, we’ll follow the same strategy we used with quantitative data – describe the shape, center, and spread, and identify any outliers. The mean of any discrete random variable is an average of the possible outcomes, with each outcome weighted by its probability. Definition: Suppose that X is a discrete random variable whose probability distribution is Value: x1x2x3 … Probability: p1p2p3 … To find the mean (expected value) of X, multiply each possible value by its probability, then add all the products:
Discrete and Continuous Random Variables • Standard Deviation of a Discrete Random Variable Since we use the mean as the measure of center for a discrete random variable, we’ll use the standard deviation as our measure of spread. The definition of the variance of a random variable is similar to the definition of the variance for a set of quantitative data. Definition: Suppose that X is a discrete random variable whose probability distribution is Value: x1x2x3 … Probability: p1p2p3 … and that µXis the mean of X. The variance of X is To get the standard deviation of a random variable, take the square root of the variance.
Discrete and Continuous Random Variables • Continuous Random Variables Discrete random variables commonly arise from situations that involve counting something. Situations that involve measuring something often result in a continuous random variable. Definition: A continuous random variableX takes on all values in an interval of numbers. The probability distribution of X is described by a density curve. The probability of any event is the area under the density curve and above the values of X that make up the event. The probability model of a discrete random variable X assigns a probability between 0 and 1 to each possible value of X. A continuous random variable Y has infinitely many possible values. All continuous probability models assign probability 0 to every individual outcome. Only intervals of values have positive probability.
Example: Young Women’s Heights Read the example on page 351. Define Y as the height of a randomly chosen young woman. Y is a continuous random variable whose probability distribution is N(64, 2.7). What is the probability that a randomly chosen young woman has height between 68 and 70 inches? P(68 ≤ Y ≤ 70) = ??? P(1.48 ≤ Z ≤ 2.22) = P(Z ≤ 2.22) – P(Z ≤ 1.48) = 0.9868 – 0.9306 = 0.0562 There is about a 5.6% chance that a randomly chosen young woman has a height between 68 and 70 inches.